Immigrants from Dominican Republic vs Immigrants from Morocco Bachelor's Degree
COMPARE
Immigrants from Dominican Republic
Immigrants from Morocco
Bachelor's Degree
Bachelor's Degree Comparison
Immigrants from Dominican Republic
Immigrants from Morocco
30.7%
BACHELOR'S DEGREE
0.0/ 100
METRIC RATING
295th/ 347
METRIC RANK
41.4%
BACHELOR'S DEGREE
98.0/ 100
METRIC RATING
101st/ 347
METRIC RANK
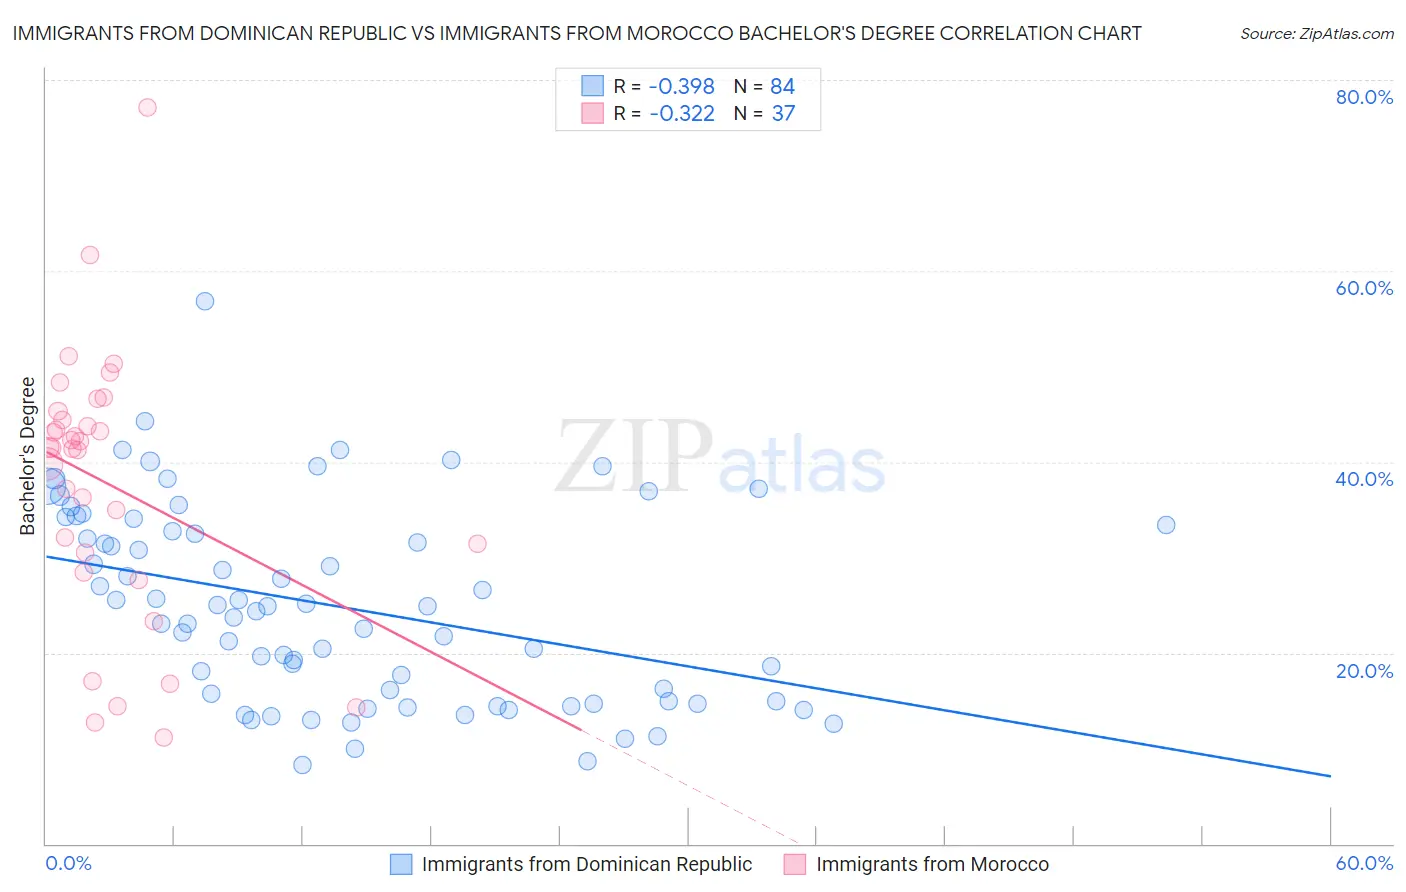
Immigrants from Dominican Republic vs Immigrants from Morocco Bachelor's Degree Correlation Chart
The statistical analysis conducted on geographies consisting of 275,132,010 people shows a mild negative correlation between the proportion of Immigrants from Dominican Republic and percentage of population with at least bachelor's degree education in the United States with a correlation coefficient (R) of -0.398 and weighted average of 30.7%. Similarly, the statistical analysis conducted on geographies consisting of 178,912,438 people shows a mild negative correlation between the proportion of Immigrants from Morocco and percentage of population with at least bachelor's degree education in the United States with a correlation coefficient (R) of -0.322 and weighted average of 41.4%, a difference of 35.0%.
Bachelor's Degree Correlation Summary
| Measurement | Immigrants from Dominican Republic | Immigrants from Morocco |
| Minimum | 8.2% | 11.1% |
| Maximum | 56.8% | 77.2% |
| Range | 48.6% | 66.0% |
| Mean | 24.9% | 37.7% |
| Median | 24.6% | 41.4% |
| Interquartile 25% (IQ1) | 14.9% | 29.5% |
| Interquartile 75% (IQ3) | 33.0% | 44.9% |
| Interquartile Range (IQR) | 18.1% | 15.4% |
| Standard Deviation (Sample) | 10.2% | 14.0% |
| Standard Deviation (Population) | 10.1% | 13.8% |
Similar Demographics by Bachelor's Degree
Demographics Similar to Immigrants from Dominican Republic by Bachelor's Degree
In terms of bachelor's degree, the demographic groups most similar to Immigrants from Dominican Republic are Puget Sound Salish (30.7%, a difference of 0.10%), Immigrants from Haiti (30.6%, a difference of 0.16%), Immigrants from Guatemala (30.8%, a difference of 0.24%), Chippewa (30.6%, a difference of 0.41%), and Cape Verdean (30.9%, a difference of 0.63%).
| Demographics | Rating | Rank | Bachelor's Degree |
| Guatemalans | 0.1 /100 | #288 | Tragic 31.0% |
| Puerto Ricans | 0.1 /100 | #289 | Tragic 31.0% |
| Immigrants | Honduras | 0.1 /100 | #290 | Tragic 30.9% |
| Blacks/African Americans | 0.1 /100 | #291 | Tragic 30.9% |
| Ute | 0.1 /100 | #292 | Tragic 30.9% |
| Cape Verdeans | 0.1 /100 | #293 | Tragic 30.9% |
| Immigrants | Guatemala | 0.0 /100 | #294 | Tragic 30.8% |
| Immigrants | Dominican Republic | 0.0 /100 | #295 | Tragic 30.7% |
| Puget Sound Salish | 0.0 /100 | #296 | Tragic 30.7% |
| Immigrants | Haiti | 0.0 /100 | #297 | Tragic 30.6% |
| Chippewa | 0.0 /100 | #298 | Tragic 30.6% |
| Chickasaw | 0.0 /100 | #299 | Tragic 30.4% |
| Immigrants | Micronesia | 0.0 /100 | #300 | Tragic 30.4% |
| Immigrants | Cuba | 0.0 /100 | #301 | Tragic 30.3% |
| Mexican American Indians | 0.0 /100 | #302 | Tragic 30.2% |
Demographics Similar to Immigrants from Morocco by Bachelor's Degree
In terms of bachelor's degree, the demographic groups most similar to Immigrants from Morocco are Macedonian (41.4%, a difference of 0.030%), Immigrants from England (41.4%, a difference of 0.060%), Immigrants from Italy (41.3%, a difference of 0.26%), Immigrants from Ukraine (41.5%, a difference of 0.29%), and Romanian (41.6%, a difference of 0.40%).
| Demographics | Rating | Rank | Bachelor's Degree |
| Immigrants | Nepal | 98.6 /100 | #94 | Exceptional 41.7% |
| Immigrants | North America | 98.5 /100 | #95 | Exceptional 41.7% |
| Immigrants | Moldova | 98.4 /100 | #96 | Exceptional 41.6% |
| Romanians | 98.4 /100 | #97 | Exceptional 41.6% |
| Immigrants | Ukraine | 98.3 /100 | #98 | Exceptional 41.5% |
| Immigrants | England | 98.1 /100 | #99 | Exceptional 41.4% |
| Macedonians | 98.1 /100 | #100 | Exceptional 41.4% |
| Immigrants | Morocco | 98.0 /100 | #101 | Exceptional 41.4% |
| Immigrants | Italy | 97.8 /100 | #102 | Exceptional 41.3% |
| Chileans | 97.5 /100 | #103 | Exceptional 41.2% |
| Jordanians | 97.4 /100 | #104 | Exceptional 41.2% |
| Syrians | 97.4 /100 | #105 | Exceptional 41.1% |
| Alsatians | 97.0 /100 | #106 | Exceptional 41.0% |
| Northern Europeans | 96.8 /100 | #107 | Exceptional 41.0% |
| Ukrainians | 96.6 /100 | #108 | Exceptional 40.9% |