Yugoslavian vs Immigrants from Morocco Currently Married
COMPARE
Yugoslavian
Immigrants from Morocco
Currently Married
Currently Married Comparison
Yugoslavians
Immigrants from Morocco
47.2%
CURRENTLY MARRIED
77.4/ 100
METRIC RATING
139th/ 347
METRIC RANK
45.4%
CURRENTLY MARRIED
5.5/ 100
METRIC RATING
216th/ 347
METRIC RANK
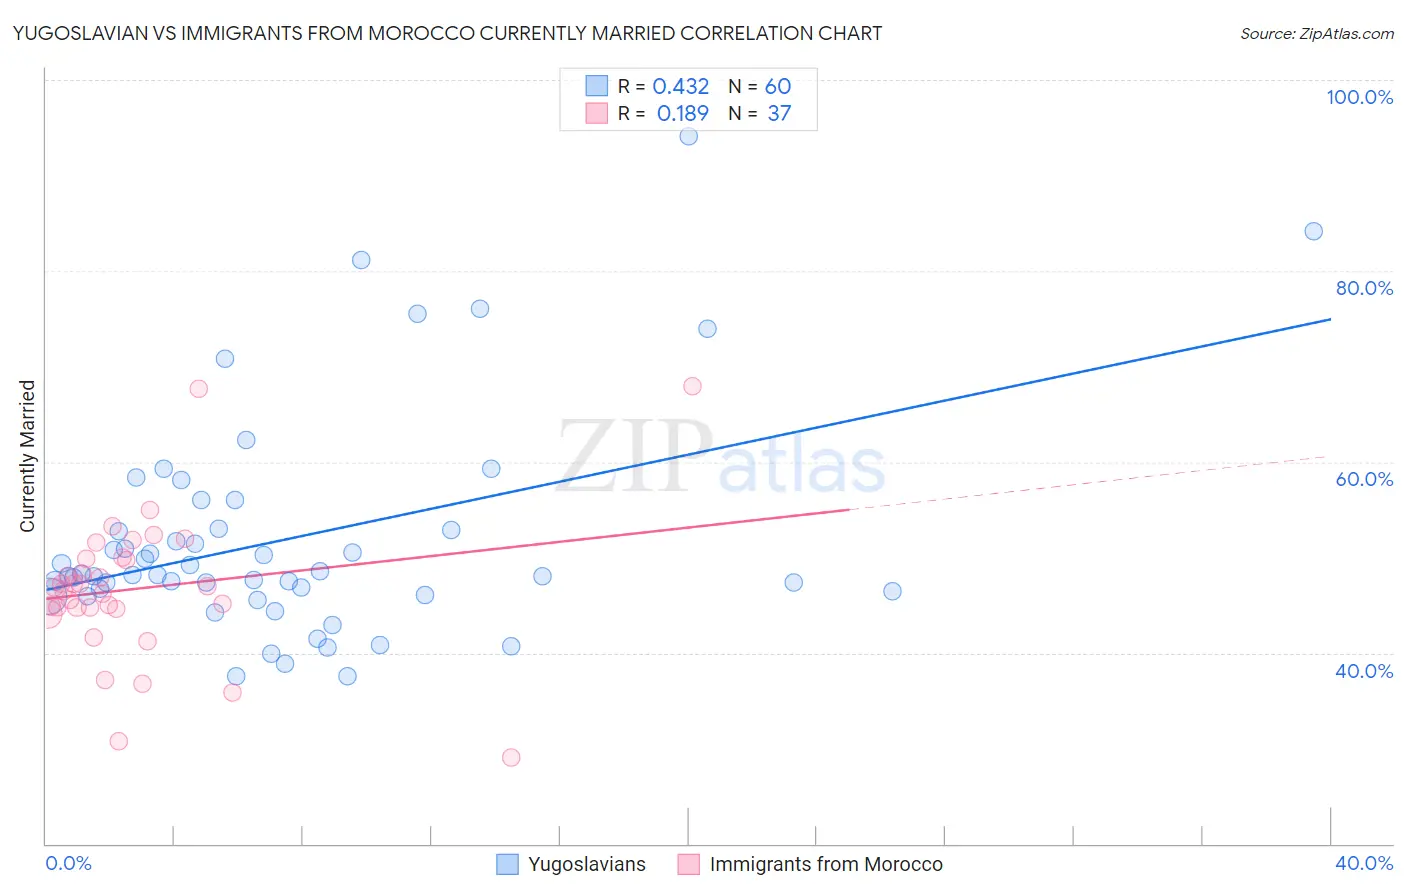
Yugoslavian vs Immigrants from Morocco Currently Married Correlation Chart
The statistical analysis conducted on geographies consisting of 285,712,182 people shows a moderate positive correlation between the proportion of Yugoslavians and percentage of population currently married in the United States with a correlation coefficient (R) of 0.432 and weighted average of 47.2%. Similarly, the statistical analysis conducted on geographies consisting of 178,912,438 people shows a poor positive correlation between the proportion of Immigrants from Morocco and percentage of population currently married in the United States with a correlation coefficient (R) of 0.189 and weighted average of 45.4%, a difference of 3.8%.
Currently Married Correlation Summary
| Measurement | Yugoslavian | Immigrants from Morocco |
| Minimum | 37.5% | 29.0% |
| Maximum | 94.1% | 67.9% |
| Range | 56.6% | 38.9% |
| Mean | 52.0% | 46.7% |
| Median | 48.2% | 46.9% |
| Interquartile 25% (IQ1) | 46.2% | 44.6% |
| Interquartile 75% (IQ3) | 52.9% | 49.9% |
| Interquartile Range (IQR) | 6.7% | 5.3% |
| Standard Deviation (Sample) | 11.6% | 7.6% |
| Standard Deviation (Population) | 11.5% | 7.5% |
Similar Demographics by Currently Married
Demographics Similar to Yugoslavians by Currently Married
In terms of currently married, the demographic groups most similar to Yugoslavians are Pakistani (47.2%, a difference of 0.0%), Paraguayan (47.2%, a difference of 0.020%), Immigrants from Vietnam (47.2%, a difference of 0.040%), Cajun (47.1%, a difference of 0.11%), and Immigrants from Norway (47.2%, a difference of 0.12%).
| Demographics | Rating | Rank | Currently Married |
| Afghans | 81.8 /100 | #132 | Excellent 47.3% |
| Immigrants | Malaysia | 81.1 /100 | #133 | Excellent 47.3% |
| Immigrants | Australia | 81.1 /100 | #134 | Excellent 47.3% |
| Immigrants | Norway | 79.7 /100 | #135 | Good 47.2% |
| Immigrants | Vietnam | 78.2 /100 | #136 | Good 47.2% |
| Paraguayans | 77.8 /100 | #137 | Good 47.2% |
| Pakistanis | 77.5 /100 | #138 | Good 47.2% |
| Yugoslavians | 77.4 /100 | #139 | Good 47.2% |
| Cajuns | 75.3 /100 | #140 | Good 47.1% |
| Venezuelans | 74.4 /100 | #141 | Good 47.1% |
| Argentineans | 74.4 /100 | #142 | Good 47.1% |
| Guamanians/Chamorros | 74.2 /100 | #143 | Good 47.1% |
| Hmong | 73.4 /100 | #144 | Good 47.1% |
| Immigrants | South Eastern Asia | 72.9 /100 | #145 | Good 47.1% |
| Carpatho Rusyns | 72.6 /100 | #146 | Good 47.0% |
Demographics Similar to Immigrants from Morocco by Currently Married
In terms of currently married, the demographic groups most similar to Immigrants from Morocco are Immigrants from Thailand (45.4%, a difference of 0.080%), Dutch West Indian (45.5%, a difference of 0.20%), German Russian (45.5%, a difference of 0.20%), Alaska Native (45.5%, a difference of 0.24%), and Houma (45.5%, a difference of 0.27%).
| Demographics | Rating | Rank | Currently Married |
| Immigrants | Micronesia | 8.8 /100 | #209 | Tragic 45.6% |
| Uruguayans | 7.9 /100 | #210 | Tragic 45.6% |
| Houma | 7.2 /100 | #211 | Tragic 45.5% |
| Marshallese | 7.2 /100 | #212 | Tragic 45.5% |
| Alaska Natives | 7.0 /100 | #213 | Tragic 45.5% |
| Dutch West Indians | 6.7 /100 | #214 | Tragic 45.5% |
| German Russians | 6.7 /100 | #215 | Tragic 45.5% |
| Immigrants | Morocco | 5.5 /100 | #216 | Tragic 45.4% |
| Immigrants | Thailand | 5.1 /100 | #217 | Tragic 45.4% |
| Panamanians | 4.0 /100 | #218 | Tragic 45.3% |
| Immigrants | Portugal | 3.5 /100 | #219 | Tragic 45.2% |
| Kenyans | 3.1 /100 | #220 | Tragic 45.2% |
| Mexicans | 3.0 /100 | #221 | Tragic 45.2% |
| Immigrants | Azores | 2.5 /100 | #222 | Tragic 45.1% |
| Immigrants | Laos | 2.3 /100 | #223 | Tragic 45.0% |