Yugoslavian vs Moroccan Bachelor's Degree
COMPARE
Yugoslavian
Moroccan
Bachelor's Degree
Bachelor's Degree Comparison
Yugoslavians
Moroccans
37.1%
BACHELOR'S DEGREE
31.5/ 100
METRIC RATING
193rd/ 347
METRIC RANK
40.5%
BACHELOR'S DEGREE
94.6/ 100
METRIC RATING
121st/ 347
METRIC RANK
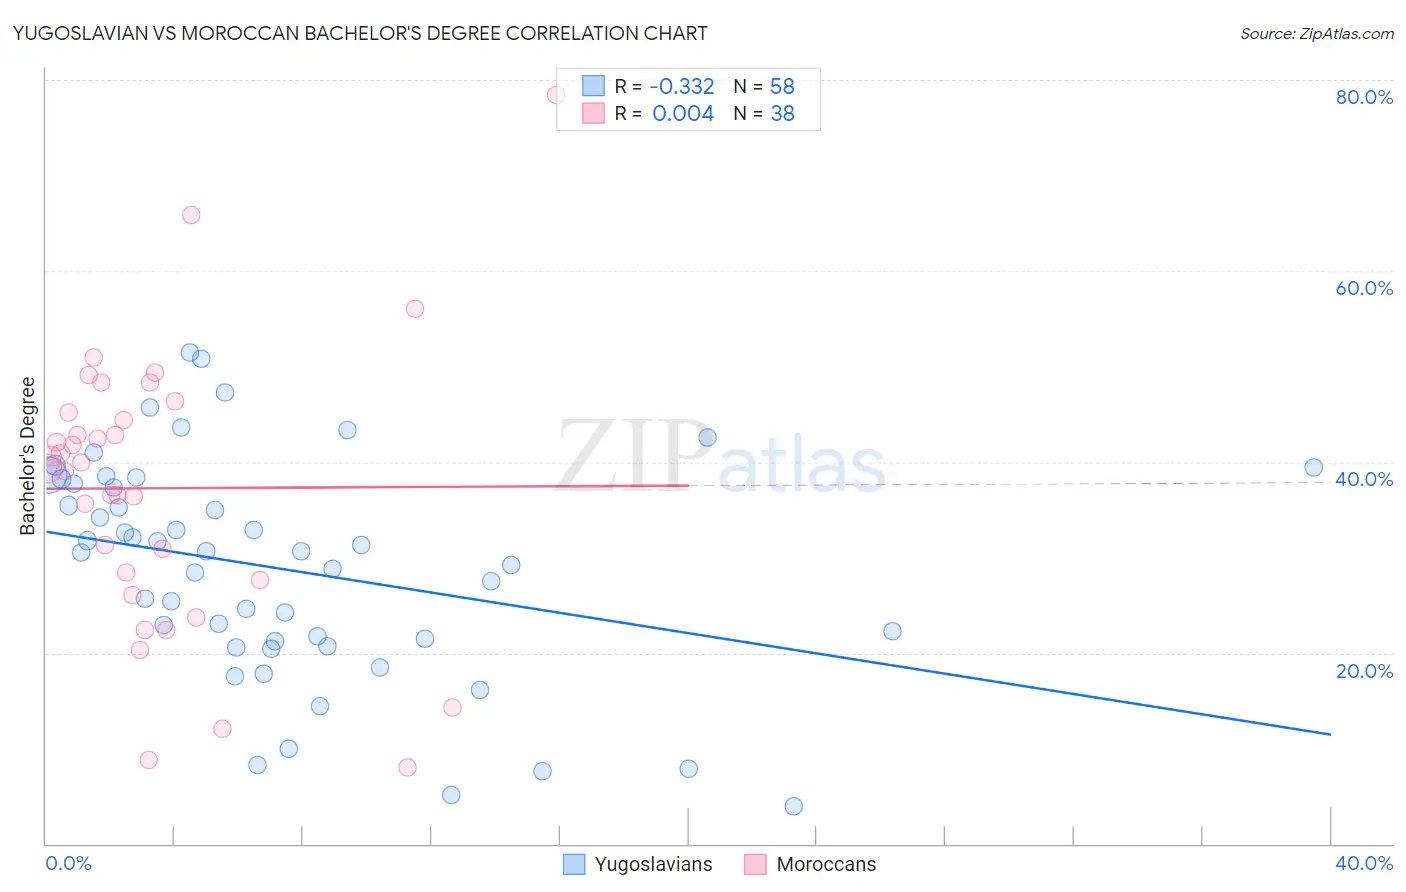
Yugoslavian vs Moroccan Bachelor's Degree Correlation Chart
The statistical analysis conducted on geographies consisting of 285,712,263 people shows a mild negative correlation between the proportion of Yugoslavians and percentage of population with at least bachelor's degree education in the United States with a correlation coefficient (R) of -0.332 and weighted average of 37.1%. Similarly, the statistical analysis conducted on geographies consisting of 201,813,734 people shows no correlation between the proportion of Moroccans and percentage of population with at least bachelor's degree education in the United States with a correlation coefficient (R) of 0.004 and weighted average of 40.5%, a difference of 9.0%.
Bachelor's Degree Correlation Summary
| Measurement | Yugoslavian | Moroccan |
| Minimum | 3.9% | 7.9% |
| Maximum | 51.4% | 78.5% |
| Range | 47.5% | 70.5% |
| Mean | 28.7% | 37.2% |
| Median | 30.6% | 39.6% |
| Interquartile 25% (IQ1) | 21.2% | 27.6% |
| Interquartile 75% (IQ3) | 37.7% | 45.2% |
| Interquartile Range (IQR) | 16.5% | 17.6% |
| Standard Deviation (Sample) | 11.5% | 14.8% |
| Standard Deviation (Population) | 11.4% | 14.6% |
Similar Demographics by Bachelor's Degree
Demographics Similar to Yugoslavians by Bachelor's Degree
In terms of bachelor's degree, the demographic groups most similar to Yugoslavians are Immigrants from Vietnam (37.1%, a difference of 0.060%), Belgian (37.0%, a difference of 0.19%), Korean (37.0%, a difference of 0.20%), Celtic (37.0%, a difference of 0.23%), and Nigerian (37.2%, a difference of 0.27%).
| Demographics | Rating | Rank | Bachelor's Degree |
| Norwegians | 40.4 /100 | #186 | Average 37.5% |
| English | 39.7 /100 | #187 | Fair 37.4% |
| Immigrants | Oceania | 37.3 /100 | #188 | Fair 37.3% |
| Slovaks | 36.9 /100 | #189 | Fair 37.3% |
| Swiss | 34.1 /100 | #190 | Fair 37.2% |
| Nigerians | 33.9 /100 | #191 | Fair 37.2% |
| Immigrants | Vietnam | 32.1 /100 | #192 | Fair 37.1% |
| Yugoslavians | 31.5 /100 | #193 | Fair 37.1% |
| Belgians | 29.9 /100 | #194 | Fair 37.0% |
| Koreans | 29.8 /100 | #195 | Fair 37.0% |
| Celtics | 29.5 /100 | #196 | Fair 37.0% |
| Czechoslovakians | 29.2 /100 | #197 | Fair 37.0% |
| Welsh | 29.1 /100 | #198 | Fair 37.0% |
| Immigrants | Costa Rica | 27.4 /100 | #199 | Fair 36.9% |
| Immigrants | Ghana | 27.4 /100 | #200 | Fair 36.9% |
Demographics Similar to Moroccans by Bachelor's Degree
In terms of bachelor's degree, the demographic groups most similar to Moroccans are Venezuelan (40.5%, a difference of 0.050%), Immigrants from Albania (40.4%, a difference of 0.10%), Immigrants from Syria (40.5%, a difference of 0.12%), Lebanese (40.4%, a difference of 0.12%), and Immigrants from Eritrea (40.4%, a difference of 0.12%).
| Demographics | Rating | Rank | Bachelor's Degree |
| Afghans | 96.2 /100 | #114 | Exceptional 40.8% |
| Palestinians | 95.8 /100 | #115 | Exceptional 40.7% |
| Immigrants | Uganda | 95.7 /100 | #116 | Exceptional 40.7% |
| Austrians | 95.5 /100 | #117 | Exceptional 40.6% |
| Croatians | 95.5 /100 | #118 | Exceptional 40.6% |
| Immigrants | Syria | 94.9 /100 | #119 | Exceptional 40.5% |
| Venezuelans | 94.7 /100 | #120 | Exceptional 40.5% |
| Moroccans | 94.6 /100 | #121 | Exceptional 40.5% |
| Immigrants | Albania | 94.4 /100 | #122 | Exceptional 40.4% |
| Lebanese | 94.3 /100 | #123 | Exceptional 40.4% |
| Immigrants | Eritrea | 94.3 /100 | #124 | Exceptional 40.4% |
| British | 94.2 /100 | #125 | Exceptional 40.4% |
| Immigrants | Eastern Africa | 94.1 /100 | #126 | Exceptional 40.4% |
| Immigrants | Jordan | 93.4 /100 | #127 | Exceptional 40.3% |
| Immigrants | Venezuela | 92.9 /100 | #128 | Exceptional 40.2% |