Yugoslavian vs Immigrants from Congo Bachelor's Degree
COMPARE
Yugoslavian
Immigrants from Congo
Bachelor's Degree
Bachelor's Degree Comparison
Yugoslavians
Immigrants from Congo
37.1%
BACHELOR'S DEGREE
31.5/ 100
METRIC RATING
193rd/ 347
METRIC RANK
33.6%
BACHELOR'S DEGREE
1.0/ 100
METRIC RATING
247th/ 347
METRIC RANK
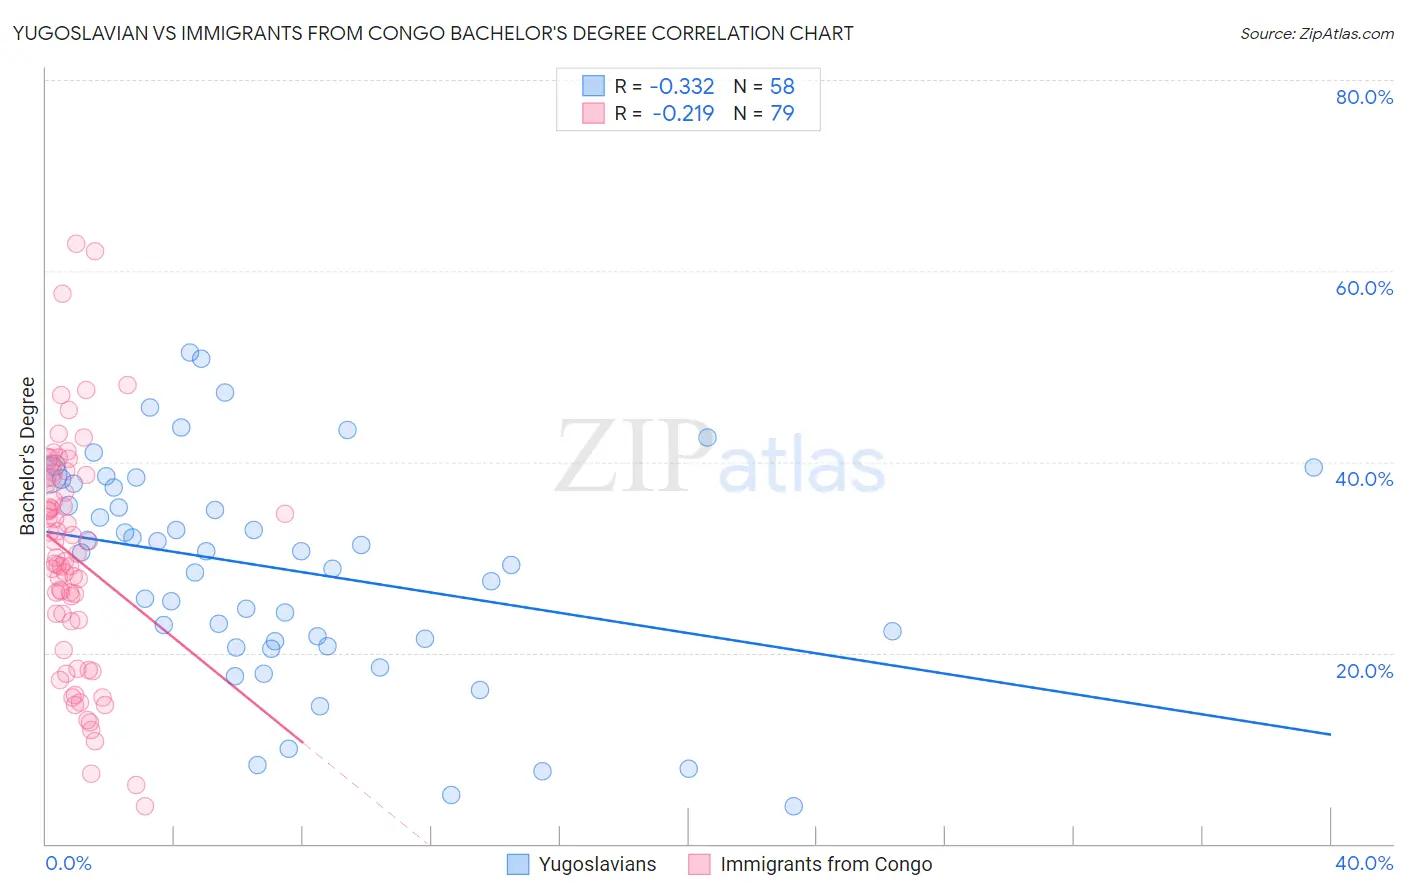
Yugoslavian vs Immigrants from Congo Bachelor's Degree Correlation Chart
The statistical analysis conducted on geographies consisting of 285,712,263 people shows a mild negative correlation between the proportion of Yugoslavians and percentage of population with at least bachelor's degree education in the United States with a correlation coefficient (R) of -0.332 and weighted average of 37.1%. Similarly, the statistical analysis conducted on geographies consisting of 92,128,050 people shows a weak negative correlation between the proportion of Immigrants from Congo and percentage of population with at least bachelor's degree education in the United States with a correlation coefficient (R) of -0.219 and weighted average of 33.6%, a difference of 10.5%.
Bachelor's Degree Correlation Summary
| Measurement | Yugoslavian | Immigrants from Congo |
| Minimum | 3.9% | 3.9% |
| Maximum | 51.4% | 62.9% |
| Range | 47.5% | 59.0% |
| Mean | 28.7% | 30.2% |
| Median | 30.6% | 30.0% |
| Interquartile 25% (IQ1) | 21.2% | 23.3% |
| Interquartile 75% (IQ3) | 37.7% | 38.4% |
| Interquartile Range (IQR) | 16.5% | 15.1% |
| Standard Deviation (Sample) | 11.5% | 12.1% |
| Standard Deviation (Population) | 11.4% | 12.0% |
Similar Demographics by Bachelor's Degree
Demographics Similar to Yugoslavians by Bachelor's Degree
In terms of bachelor's degree, the demographic groups most similar to Yugoslavians are Immigrants from Vietnam (37.1%, a difference of 0.060%), Belgian (37.0%, a difference of 0.19%), Korean (37.0%, a difference of 0.20%), Celtic (37.0%, a difference of 0.23%), and Nigerian (37.2%, a difference of 0.27%).
| Demographics | Rating | Rank | Bachelor's Degree |
| Norwegians | 40.4 /100 | #186 | Average 37.5% |
| English | 39.7 /100 | #187 | Fair 37.4% |
| Immigrants | Oceania | 37.3 /100 | #188 | Fair 37.3% |
| Slovaks | 36.9 /100 | #189 | Fair 37.3% |
| Swiss | 34.1 /100 | #190 | Fair 37.2% |
| Nigerians | 33.9 /100 | #191 | Fair 37.2% |
| Immigrants | Vietnam | 32.1 /100 | #192 | Fair 37.1% |
| Yugoslavians | 31.5 /100 | #193 | Fair 37.1% |
| Belgians | 29.9 /100 | #194 | Fair 37.0% |
| Koreans | 29.8 /100 | #195 | Fair 37.0% |
| Celtics | 29.5 /100 | #196 | Fair 37.0% |
| Czechoslovakians | 29.2 /100 | #197 | Fair 37.0% |
| Welsh | 29.1 /100 | #198 | Fair 37.0% |
| Immigrants | Costa Rica | 27.4 /100 | #199 | Fair 36.9% |
| Immigrants | Ghana | 27.4 /100 | #200 | Fair 36.9% |
Demographics Similar to Immigrants from Congo by Bachelor's Degree
In terms of bachelor's degree, the demographic groups most similar to Immigrants from Congo are Cree (33.6%, a difference of 0.010%), Jamaican (33.6%, a difference of 0.090%), Immigrants from Liberia (33.5%, a difference of 0.14%), Indonesian (33.5%, a difference of 0.15%), and Immigrants from Fiji (33.7%, a difference of 0.45%).
| Demographics | Rating | Rank | Bachelor's Degree |
| Tongans | 2.0 /100 | #240 | Tragic 34.3% |
| Immigrants | Cambodia | 1.9 /100 | #241 | Tragic 34.2% |
| Immigrants | Nonimmigrants | 1.8 /100 | #242 | Tragic 34.2% |
| Immigrants | Guyana | 1.4 /100 | #243 | Tragic 33.9% |
| Delaware | 1.2 /100 | #244 | Tragic 33.8% |
| Immigrants | Fiji | 1.2 /100 | #245 | Tragic 33.7% |
| Jamaicans | 1.0 /100 | #246 | Tragic 33.6% |
| Immigrants | Congo | 1.0 /100 | #247 | Tragic 33.6% |
| Cree | 1.0 /100 | #248 | Tragic 33.6% |
| Immigrants | Liberia | 0.9 /100 | #249 | Tragic 33.5% |
| Indonesians | 0.9 /100 | #250 | Tragic 33.5% |
| Japanese | 0.7 /100 | #251 | Tragic 33.3% |
| Immigrants | Bahamas | 0.7 /100 | #252 | Tragic 33.3% |
| U.S. Virgin Islanders | 0.7 /100 | #253 | Tragic 33.2% |
| Native Hawaiians | 0.7 /100 | #254 | Tragic 33.2% |