Guyanese vs Immigrants from Morocco Bachelor's Degree

COMPARE

Guyanese
Race
Ancestry
AfghanAfricanAlaska NativeAlaskan AthabascanAlbanianAleutAlsatianAmericanApacheArabArapahoArgentineanArmenianAssyrian/Chaldean/SyriacAustralianAustrianBahamianBangladeshiBarbadianBasqueBelgianBelizeanBermudanBhutaneseBlackfeetBolivianBrazilianBritishBritish West IndianBulgarianBurmeseCajunCambodianCanadianCape VerdeanCarpatho RusynCelticCentral AmericanCentral American IndianCherokeeCheyenneChickasawChileanChineseChippewaChoctawColombianColvilleComancheCosta RicanCreeCreekCroatianCrowCubanCypriotCzechCzechoslovakianDanishDelawareDominicanDutchDutch West IndianEastern EuropeanEcuadorianEgyptianEnglishEstonianEthiopianEuropeanFijianFilipinoFinnishFrenchFrench American IndianFrench CanadianGermanGerman RussianGhanaianGreekGuamanian/ChamorroGuatemalanGuyaneseHaitianHmongHonduranHopiHoumaHungarianIcelanderIndian (Asian)IndonesianInupiatIranianIraqiIrishIroquoisIsraeliItalianJamaicanJapaneseJordanianKenyanKiowaKoreanLaotianLatvianLebaneseLiberianLithuanianLumbeeLuxembourgerMacedonianMalaysianMalteseMarshalleseMenomineeMexicanMexican American IndianMongolianMoroccanNative HawaiianNavajoNepaleseNew ZealanderNicaraguanNigerianNorthern EuropeanNorwegianOkinawanOsageOttawaPaiutePakistaniPalestinianPanamanianParaguayanPennsylvania GermanPeruvianPimaPolishPortuguesePotawatomiPuebloPuerto RicanPuget Sound SalishRomanianRussianSalvadoranSamoanScandinavianScotch-IrishScottishSeminoleSenegaleseSerbianShoshoneSierra LeoneanSiouxSlavicSlovakSloveneSomaliSouth AfricanSouth AmericanSouth American IndianSoviet UnionSpaniardSpanishSpanish AmericanSpanish American IndianSri LankanSubsaharan AfricanSudaneseSwedishSwissSyrianTaiwaneseThaiTlingit-HaidaTohono O'OdhamTonganTrinidadian and TobagonianTsimshianTurkishU.S. Virgin IslanderUgandanUkrainianUruguayanUteVenezuelanVietnameseWelshWest IndianYakamaYaquiYugoslavianYumanYup'ikZimbabwean
Immigration
NonimmigrantsImmigrantsAfghanistanAfricaAlbaniaArgentinaArmeniaAsiaAustraliaAustriaBahamasBangladeshBarbadosBelarusBelgiumBelizeBoliviaBosnia and HerzegovinaBrazilBulgariaBurma/MyanmarCabo VerdeCambodiaCameroonCanadaCaribbeanCentral AmericaChileChinaColombiaCongoCosta RicaCroatiaCubaCzechoslovakiaDenmarkDominicaDominican RepublicEastern AfricaEastern AsiaEastern EuropeEcuadorEgyptEl SalvadorEnglandEritreaEthiopiaEuropeFijiFranceGermanyGhanaGreeceGrenadaGuatemalaGuyanaHaitiHondurasHong KongHungaryIndiaIndonesiaIranIraqIrelandIsraelItalyJamaicaJapanJordanKazakhstanKenyaKoreaKuwaitLaosLatin AmericaLatviaLebanonLiberiaLithuaniaMalaysiaMexicoMicronesiaMiddle AfricaMoldovaNepalNetherlandsNicaraguaNigeriaNorth AmericaNorth MacedoniaNorthern AfricaNorthern EuropeNorwayOceaniaPakistanPanamaPeruPhilippinesPolandPortugalRomaniaRussiaSaudi ArabiaScotlandSenegalSerbiaSierra LeoneSingaporeSomaliaSouth AfricaSouth AmericaSouth Central AsiaSouth Eastern AsiaSouthern EuropeSpainSri LankaSt. Vincent and the GrenadinesSudanSwedenSwitzerlandSyriaTaiwanThailandTrinidad and TobagoTurkeyUgandaUkraineUruguayUzbekistanVenezuelaVietnamWest IndiesWestern AfricaWestern AsiaWestern EuropeYemenZaireZimbabweAzores
Immigrants from Morocco
Race
Ancestry
AfghanAfricanAlaska NativeAlaskan AthabascanAlbanianAleutAlsatianAmericanApacheArabArapahoArgentineanArmenianAssyrian/Chaldean/SyriacAustralianAustrianBahamianBangladeshiBarbadianBasqueBelgianBelizeanBermudanBhutaneseBlackfeetBolivianBrazilianBritishBritish West IndianBulgarianBurmeseCajunCambodianCanadianCape VerdeanCarpatho RusynCelticCentral AmericanCentral American IndianCherokeeCheyenneChickasawChileanChineseChippewaChoctawColombianColvilleComancheCosta RicanCreeCreekCroatianCrowCubanCypriotCzechCzechoslovakianDanishDelawareDominicanDutchDutch West IndianEastern EuropeanEcuadorianEgyptianEnglishEstonianEthiopianEuropeanFijianFilipinoFinnishFrenchFrench American IndianFrench CanadianGermanGerman RussianGhanaianGreekGuamanian/ChamorroGuatemalanHaitianHmongHonduranHopiHoumaHungarianIcelanderIndian (Asian)IndonesianInupiatIranianIraqiIrishIroquoisIsraeliItalianJamaicanJapaneseJordanianKenyanKiowaKoreanLaotianLatvianLebaneseLiberianLithuanianLumbeeLuxembourgerMacedonianMalaysianMalteseMarshalleseMenomineeMexicanMexican American IndianMongolianMoroccanNative HawaiianNavajoNepaleseNew ZealanderNicaraguanNigerianNorthern EuropeanNorwegianOkinawanOsageOttawaPaiutePakistaniPalestinianPanamanianParaguayanPennsylvania GermanPeruvianPimaPolishPortuguesePotawatomiPuebloPuerto RicanPuget Sound SalishRomanianRussianSalvadoranSamoanScandinavianScotch-IrishScottishSeminoleSenegaleseSerbianShoshoneSierra LeoneanSiouxSlavicSlovakSloveneSomaliSouth AfricanSouth AmericanSouth American IndianSoviet UnionSpaniardSpanishSpanish AmericanSpanish American IndianSri LankanSubsaharan AfricanSudaneseSwedishSwissSyrianTaiwaneseThaiTlingit-HaidaTohono O'OdhamTonganTrinidadian and TobagonianTsimshianTurkishU.S. Virgin IslanderUgandanUkrainianUruguayanUteVenezuelanVietnameseWelshWest IndianYakamaYaquiYugoslavianYumanYup'ikZimbabwean
Immigration
NonimmigrantsImmigrantsAfghanistanAfricaAlbaniaArgentinaArmeniaAsiaAustraliaAustriaBahamasBangladeshBarbadosBelarusBelgiumBelizeBoliviaBosnia and HerzegovinaBrazilBulgariaBurma/MyanmarCabo VerdeCambodiaCameroonCanadaCaribbeanCentral AmericaChileChinaColombiaCongoCosta RicaCroatiaCubaCzechoslovakiaDenmarkDominicaDominican RepublicEastern AfricaEastern AsiaEastern EuropeEcuadorEgyptEl SalvadorEnglandEritreaEthiopiaEuropeFijiFranceGermanyGhanaGreeceGrenadaGuatemalaGuyanaHaitiHondurasHong KongHungaryIndiaIndonesiaIranIraqIrelandIsraelItalyJamaicaJapanJordanKazakhstanKenyaKoreaKuwaitLaosLatin AmericaLatviaLebanonLiberiaLithuaniaMalaysiaMexicoMicronesiaMiddle AfricaMoldovaMoroccoNepalNetherlandsNicaraguaNigeriaNorth AmericaNorth MacedoniaNorthern AfricaNorthern EuropeNorwayOceaniaPakistanPanamaPeruPhilippinesPolandPortugalRomaniaRussiaSaudi ArabiaScotlandSenegalSerbiaSierra LeoneSingaporeSomaliaSouth AfricaSouth AmericaSouth Central AsiaSouth Eastern AsiaSouthern EuropeSpainSri LankaSt. Vincent and the GrenadinesSudanSwedenSwitzerlandSyriaTaiwanThailandTrinidad and TobagoTurkeyUgandaUkraineUruguayUzbekistanVenezuelaVietnamWest IndiesWestern AfricaWestern AsiaWestern EuropeYemenZaireZimbabweAzores
Bachelor's Degree
Income
Poverty
Unemployment
Labor Participation
Family Structure
Vehicle Availability
Education Level
Disability

Bachelor's Degree Comparison

Guyanese

Immigrants from Morocco

Tragic
Exceptional
34.5%
BACHELOR'S DEGREE
2.5/ 100
METRIC RATING
238th/ 347
METRIC RANK
41.4%
BACHELOR'S DEGREE
98.0/ 100
METRIC RATING
101st/ 347
METRIC RANK

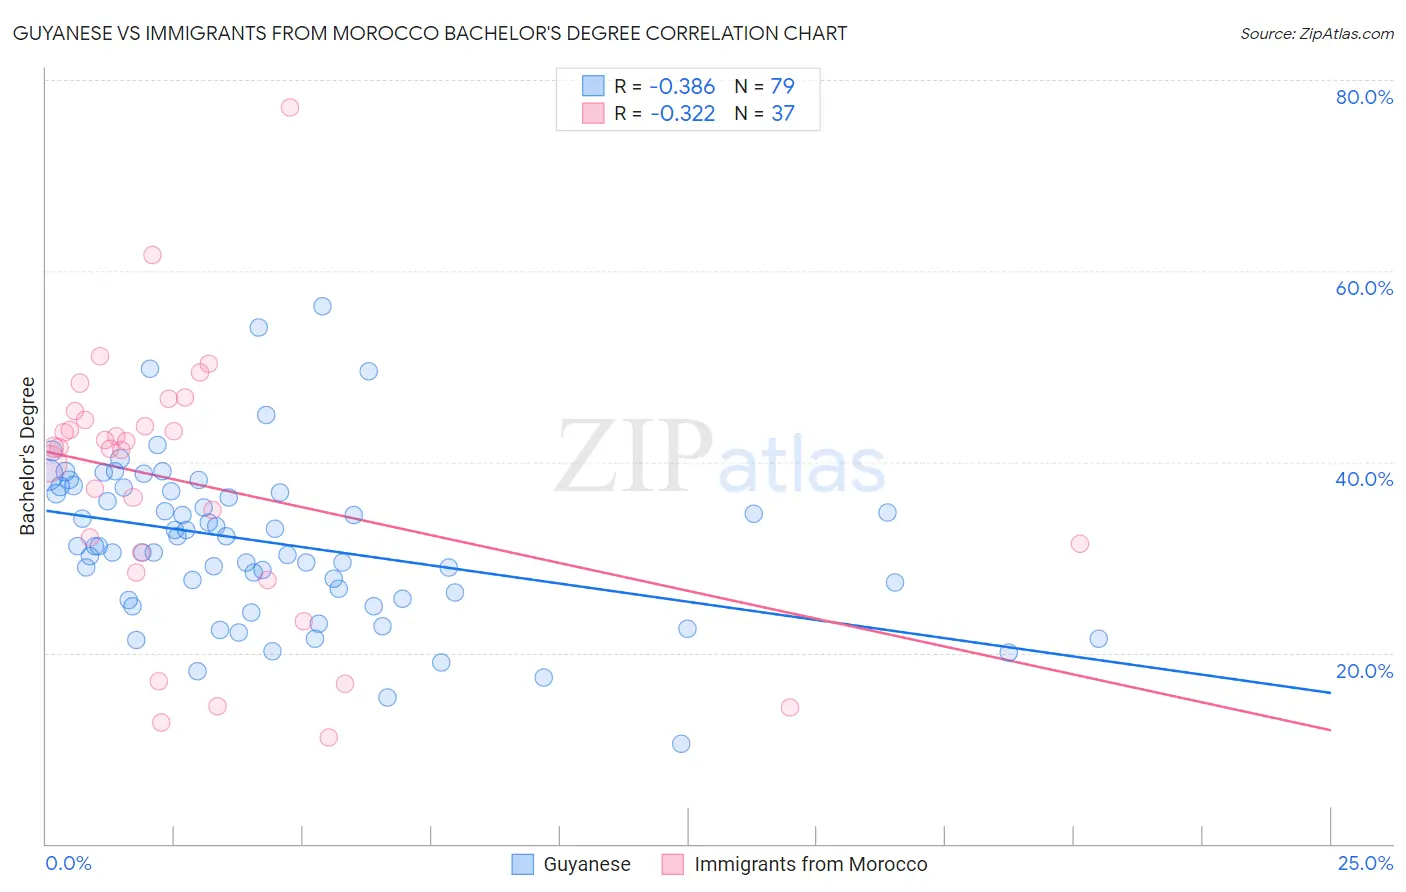
Guyanese vs Immigrants from Morocco Bachelor's Degree Correlation Chart

The statistical analysis conducted on geographies consisting of 176,919,737 people shows a mild negative correlation between the proportion of Guyanese and percentage of population with at least bachelor's degree education in the United States with a correlation coefficient (R) of -0.386 and weighted average of 34.5%. Similarly, the statistical analysis conducted on geographies consisting of 178,912,438 people shows a mild negative correlation between the proportion of Immigrants from Morocco and percentage of population with at least bachelor's degree education in the United States with a correlation coefficient (R) of -0.322 and weighted average of 41.4%, a difference of 20.2%.
Guyanese vs Immigrants from Morocco Bachelor's Degree

Bachelor's Degree Correlation Summary

MeasurementGuyaneseImmigrants from Morocco
Minimum10.5%11.1%
Maximum56.4%77.2%
Range45.9%66.0%
Mean31.5%37.7%
Median31.2%41.4%
Interquartile 25% (IQ1)25.6%29.5%
Interquartile 75% (IQ3)36.9%44.9%
Interquartile Range (IQR)11.3%15.4%
Standard Deviation (Sample)8.4%14.0%
Standard Deviation (Population)8.4%13.8%

Similar Demographics by Bachelor's Degree

Demographics Similar to Guyanese by Bachelor's Degree

In terms of bachelor's degree, the demographic groups most similar to Guyanese are British West Indian (34.5%, a difference of 0.020%), Tlingit-Haida (34.6%, a difference of 0.28%), Liberian (34.6%, a difference of 0.32%), Immigrants from West Indies (34.6%, a difference of 0.43%), and Guamanian/Chamorro (34.6%, a difference of 0.52%).
DemographicsRating | RankBachelor's Degree
Immigrants | St. Vincent and the Grenadines
4.3
/100
|
#231
Tragic
35.0%
Hmong
3.4
/100
|
#232
Tragic
34.8%
Immigrants | Ecuador
3.3
/100
|
#233
Tragic
34.7%
Guamanians/Chamorros
3.0
/100
|
#234
Tragic
34.6%
Immigrants | West Indies
2.9
/100
|
#235
Tragic
34.6%
Liberians
2.8
/100
|
#236
Tragic
34.6%
Tlingit-Haida
2.8
/100
|
#237
Tragic
34.6%
Guyanese
2.5
/100
|
#238
Tragic
34.5%
British West Indians
2.5
/100
|
#239
Tragic
34.5%
Tongans
2.0
/100
|
#240
Tragic
34.3%
Immigrants | Cambodia
1.9
/100
|
#241
Tragic
34.2%
Immigrants | Nonimmigrants
1.8
/100
|
#242
Tragic
34.2%
Immigrants | Guyana
1.4
/100
|
#243
Tragic
33.9%
Delaware
1.2
/100
|
#244
Tragic
33.8%
Immigrants | Fiji
1.2
/100
|
#245
Tragic
33.7%

Demographics Similar to Immigrants from Morocco by Bachelor's Degree

In terms of bachelor's degree, the demographic groups most similar to Immigrants from Morocco are Macedonian (41.4%, a difference of 0.030%), Immigrants from England (41.4%, a difference of 0.060%), Immigrants from Italy (41.3%, a difference of 0.26%), Immigrants from Ukraine (41.5%, a difference of 0.29%), and Romanian (41.6%, a difference of 0.40%).
DemographicsRating | RankBachelor's Degree
Immigrants | Nepal
98.6
/100
|
#94
Exceptional
41.7%
Immigrants | North America
98.5
/100
|
#95
Exceptional
41.7%
Immigrants | Moldova
98.4
/100
|
#96
Exceptional
41.6%
Romanians
98.4
/100
|
#97
Exceptional
41.6%
Immigrants | Ukraine
98.3
/100
|
#98
Exceptional
41.5%
Immigrants | England
98.1
/100
|
#99
Exceptional
41.4%
Macedonians
98.1
/100
|
#100
Exceptional
41.4%
Immigrants | Morocco
98.0
/100
|
#101
Exceptional
41.4%
Immigrants | Italy
97.8
/100
|
#102
Exceptional
41.3%
Chileans
97.5
/100
|
#103
Exceptional
41.2%
Jordanians
97.4
/100
|
#104
Exceptional
41.2%
Syrians
97.4
/100
|
#105
Exceptional
41.1%
Alsatians
97.0
/100
|
#106
Exceptional
41.0%
Northern Europeans
96.8
/100
|
#107
Exceptional
41.0%
Ukrainians
96.6
/100
|
#108
Exceptional
40.9%