Immigrants from Hungary vs Immigrants from Morocco Bachelor's Degree
COMPARE
Immigrants from Hungary
Immigrants from Morocco
Bachelor's Degree
Bachelor's Degree Comparison
Immigrants from Hungary
Immigrants from Morocco
42.3%
BACHELOR'S DEGREE
99.2/ 100
METRIC RATING
81st/ 347
METRIC RANK
41.4%
BACHELOR'S DEGREE
98.0/ 100
METRIC RATING
101st/ 347
METRIC RANK
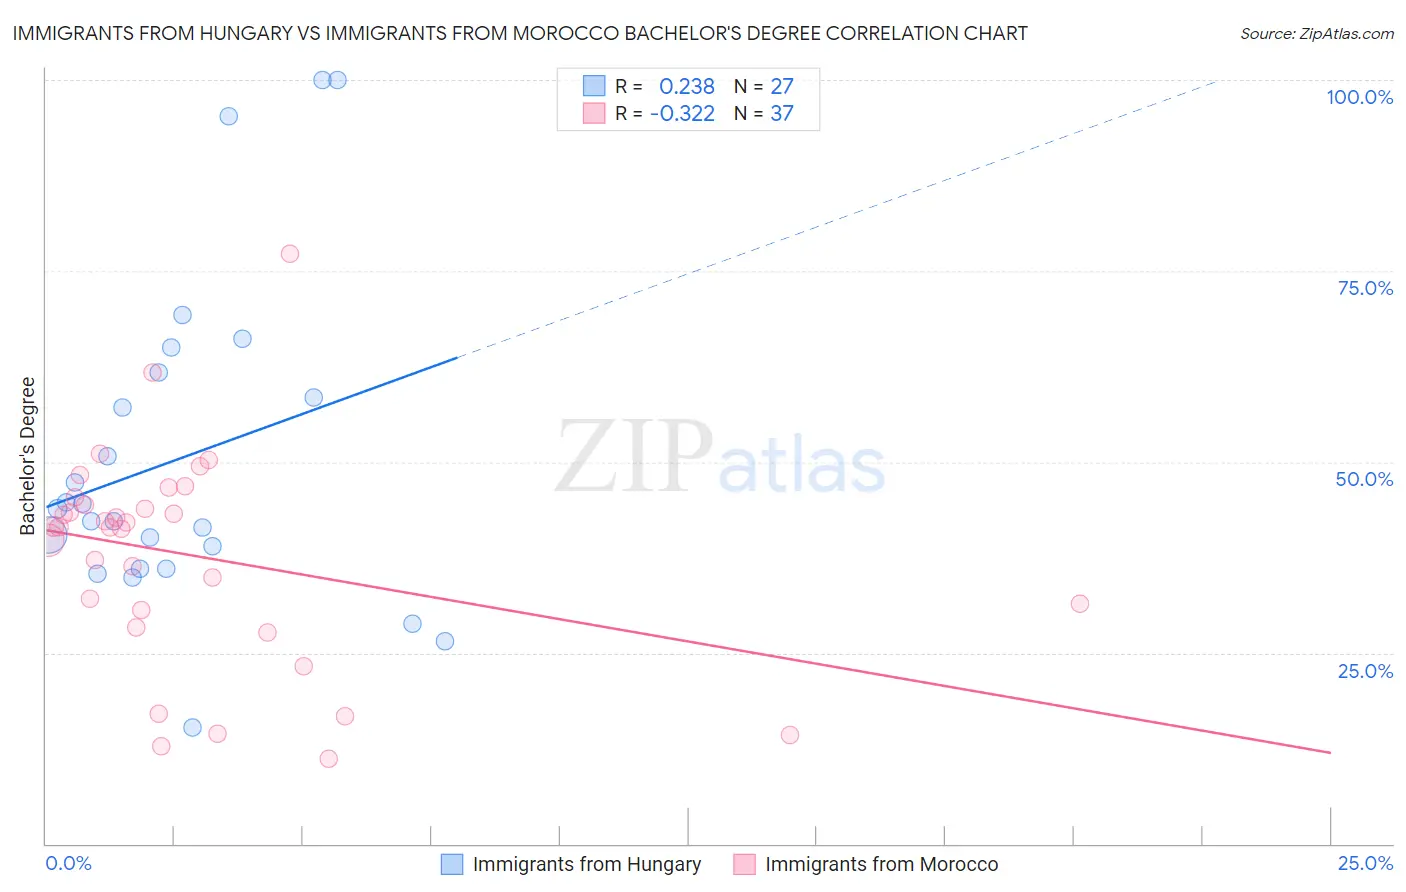
Immigrants from Hungary vs Immigrants from Morocco Bachelor's Degree Correlation Chart
The statistical analysis conducted on geographies consisting of 195,704,422 people shows a weak positive correlation between the proportion of Immigrants from Hungary and percentage of population with at least bachelor's degree education in the United States with a correlation coefficient (R) of 0.238 and weighted average of 42.3%. Similarly, the statistical analysis conducted on geographies consisting of 178,912,438 people shows a mild negative correlation between the proportion of Immigrants from Morocco and percentage of population with at least bachelor's degree education in the United States with a correlation coefficient (R) of -0.322 and weighted average of 41.4%, a difference of 2.1%.
Bachelor's Degree Correlation Summary
| Measurement | Immigrants from Hungary | Immigrants from Morocco |
| Minimum | 15.2% | 11.1% |
| Maximum | 100.0% | 77.2% |
| Range | 84.8% | 66.0% |
| Mean | 50.5% | 37.7% |
| Median | 43.9% | 41.4% |
| Interquartile 25% (IQ1) | 36.1% | 29.5% |
| Interquartile 75% (IQ3) | 61.7% | 44.9% |
| Interquartile Range (IQR) | 25.6% | 15.4% |
| Standard Deviation (Sample) | 21.3% | 14.0% |
| Standard Deviation (Population) | 20.9% | 13.8% |
Demographics Similar to Immigrants from Hungary and Immigrants from Morocco by Bachelor's Degree
In terms of bachelor's degree, the demographic groups most similar to Immigrants from Hungary are Immigrants from Scotland (42.3%, a difference of 0.070%), Armenian (42.3%, a difference of 0.10%), Immigrants from Western Asia (42.3%, a difference of 0.11%), Lithuanian (42.2%, a difference of 0.14%), and Immigrants from Brazil (42.2%, a difference of 0.22%). Similarly, the demographic groups most similar to Immigrants from Morocco are Macedonian (41.4%, a difference of 0.030%), Immigrants from England (41.4%, a difference of 0.060%), Immigrants from Ukraine (41.5%, a difference of 0.29%), Romanian (41.6%, a difference of 0.40%), and Immigrants from Moldova (41.6%, a difference of 0.45%).
| Demographics | Rating | Rank | Bachelor's Degree |
| Immigrants | Hungary | 99.2 /100 | #81 | Exceptional 42.3% |
| Immigrants | Scotland | 99.2 /100 | #82 | Exceptional 42.3% |
| Armenians | 99.2 /100 | #83 | Exceptional 42.3% |
| Immigrants | Western Asia | 99.2 /100 | #84 | Exceptional 42.3% |
| Lithuanians | 99.2 /100 | #85 | Exceptional 42.2% |
| Immigrants | Brazil | 99.2 /100 | #86 | Exceptional 42.2% |
| Carpatho Rusyns | 99.0 /100 | #87 | Exceptional 42.1% |
| Immigrants | Western Europe | 99.0 /100 | #88 | Exceptional 42.0% |
| Greeks | 99.0 /100 | #89 | Exceptional 42.0% |
| Laotians | 98.9 /100 | #90 | Exceptional 42.0% |
| Immigrants | Northern Africa | 98.9 /100 | #91 | Exceptional 41.9% |
| Maltese | 98.8 /100 | #92 | Exceptional 41.9% |
| Immigrants | Canada | 98.6 /100 | #93 | Exceptional 41.7% |
| Immigrants | Nepal | 98.6 /100 | #94 | Exceptional 41.7% |
| Immigrants | North America | 98.5 /100 | #95 | Exceptional 41.7% |
| Immigrants | Moldova | 98.4 /100 | #96 | Exceptional 41.6% |
| Romanians | 98.4 /100 | #97 | Exceptional 41.6% |
| Immigrants | Ukraine | 98.3 /100 | #98 | Exceptional 41.5% |
| Immigrants | England | 98.1 /100 | #99 | Exceptional 41.4% |
| Macedonians | 98.1 /100 | #100 | Exceptional 41.4% |
| Immigrants | Morocco | 98.0 /100 | #101 | Exceptional 41.4% |