Yugoslavian vs Immigrants from Czechoslovakia Associate's Degree
COMPARE
Yugoslavian
Immigrants from Czechoslovakia
Associate's Degree
Associate's Degree Comparison
Yugoslavians
Immigrants from Czechoslovakia
46.0%
ASSOCIATE'S DEGREE
40.2/ 100
METRIC RATING
183rd/ 347
METRIC RANK
51.9%
ASSOCIATE'S DEGREE
99.8/ 100
METRIC RATING
56th/ 347
METRIC RANK
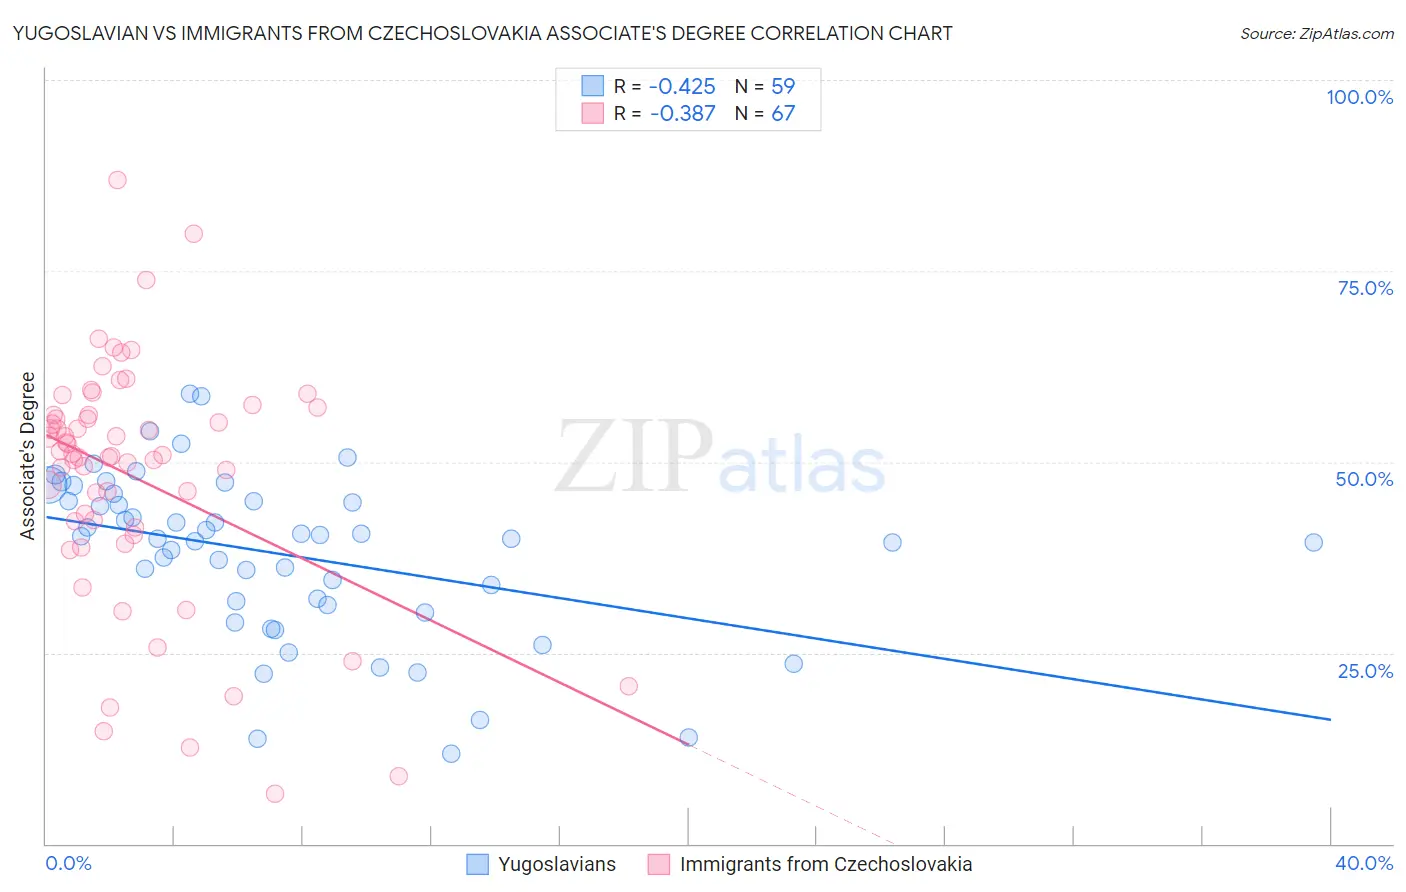
Yugoslavian vs Immigrants from Czechoslovakia Associate's Degree Correlation Chart
The statistical analysis conducted on geographies consisting of 285,717,072 people shows a moderate negative correlation between the proportion of Yugoslavians and percentage of population with at least associate's degree education in the United States with a correlation coefficient (R) of -0.425 and weighted average of 46.0%. Similarly, the statistical analysis conducted on geographies consisting of 195,448,477 people shows a mild negative correlation between the proportion of Immigrants from Czechoslovakia and percentage of population with at least associate's degree education in the United States with a correlation coefficient (R) of -0.387 and weighted average of 51.9%, a difference of 12.8%.
Associate's Degree Correlation Summary
| Measurement | Yugoslavian | Immigrants from Czechoslovakia |
| Minimum | 11.8% | 6.6% |
| Maximum | 58.9% | 86.9% |
| Range | 47.2% | 80.3% |
| Mean | 37.9% | 47.9% |
| Median | 40.0% | 50.9% |
| Interquartile 25% (IQ1) | 31.3% | 41.4% |
| Interquartile 75% (IQ3) | 44.9% | 56.2% |
| Interquartile Range (IQR) | 13.6% | 14.7% |
| Standard Deviation (Sample) | 10.8% | 15.9% |
| Standard Deviation (Population) | 10.7% | 15.8% |
Similar Demographics by Associate's Degree
Demographics Similar to Yugoslavians by Associate's Degree
In terms of associate's degree, the demographic groups most similar to Yugoslavians are Swiss (46.0%, a difference of 0.010%), Czechoslovakian (46.0%, a difference of 0.020%), Immigrants from Colombia (46.0%, a difference of 0.080%), Costa Rican (46.0%, a difference of 0.13%), and Welsh (45.9%, a difference of 0.19%).
| Demographics | Rating | Rank | Associate's Degree |
| Finns | 48.5 /100 | #176 | Average 46.3% |
| Slovaks | 48.4 /100 | #177 | Average 46.3% |
| Immigrants | Bosnia and Herzegovina | 48.3 /100 | #178 | Average 46.3% |
| Sri Lankans | 47.6 /100 | #179 | Average 46.3% |
| Bermudans | 46.4 /100 | #180 | Average 46.2% |
| Immigrants | Colombia | 41.3 /100 | #181 | Average 46.0% |
| Swiss | 40.4 /100 | #182 | Average 46.0% |
| Yugoslavians | 40.2 /100 | #183 | Average 46.0% |
| Czechoslovakians | 40.0 /100 | #184 | Average 46.0% |
| Costa Ricans | 38.6 /100 | #185 | Fair 46.0% |
| Welsh | 37.9 /100 | #186 | Fair 45.9% |
| Immigrants | Uruguay | 35.5 /100 | #187 | Fair 45.8% |
| Ghanaians | 35.5 /100 | #188 | Fair 45.8% |
| Immigrants | Oceania | 34.7 /100 | #189 | Fair 45.8% |
| Vietnamese | 34.0 /100 | #190 | Fair 45.8% |
Demographics Similar to Immigrants from Czechoslovakia by Associate's Degree
In terms of associate's degree, the demographic groups most similar to Immigrants from Czechoslovakia are Australian (51.9%, a difference of 0.020%), Immigrants from Spain (51.9%, a difference of 0.050%), Paraguayan (51.8%, a difference of 0.12%), Immigrants from Asia (52.0%, a difference of 0.15%), and New Zealander (51.8%, a difference of 0.15%).
| Demographics | Rating | Rank | Associate's Degree |
| Immigrants | Austria | 99.9 /100 | #49 | Exceptional 52.1% |
| Asians | 99.9 /100 | #50 | Exceptional 52.1% |
| Immigrants | Greece | 99.9 /100 | #51 | Exceptional 52.1% |
| Bolivians | 99.8 /100 | #52 | Exceptional 52.0% |
| Immigrants | Asia | 99.8 /100 | #53 | Exceptional 52.0% |
| Immigrants | Spain | 99.8 /100 | #54 | Exceptional 51.9% |
| Australians | 99.8 /100 | #55 | Exceptional 51.9% |
| Immigrants | Czechoslovakia | 99.8 /100 | #56 | Exceptional 51.9% |
| Paraguayans | 99.8 /100 | #57 | Exceptional 51.8% |
| New Zealanders | 99.8 /100 | #58 | Exceptional 51.8% |
| Immigrants | Serbia | 99.8 /100 | #59 | Exceptional 51.7% |
| Immigrants | Bolivia | 99.7 /100 | #60 | Exceptional 51.5% |
| Immigrants | Kazakhstan | 99.7 /100 | #61 | Exceptional 51.4% |
| Bhutanese | 99.7 /100 | #62 | Exceptional 51.4% |
| South Africans | 99.7 /100 | #63 | Exceptional 51.4% |