Immigrants from Kenya vs Immigrants from Czechoslovakia Associate's Degree
COMPARE
Immigrants from Kenya
Immigrants from Czechoslovakia
Associate's Degree
Associate's Degree Comparison
Immigrants from Kenya
Immigrants from Czechoslovakia
47.2%
ASSOCIATE'S DEGREE
72.1/ 100
METRIC RATING
154th/ 347
METRIC RANK
51.9%
ASSOCIATE'S DEGREE
99.8/ 100
METRIC RATING
56th/ 347
METRIC RANK
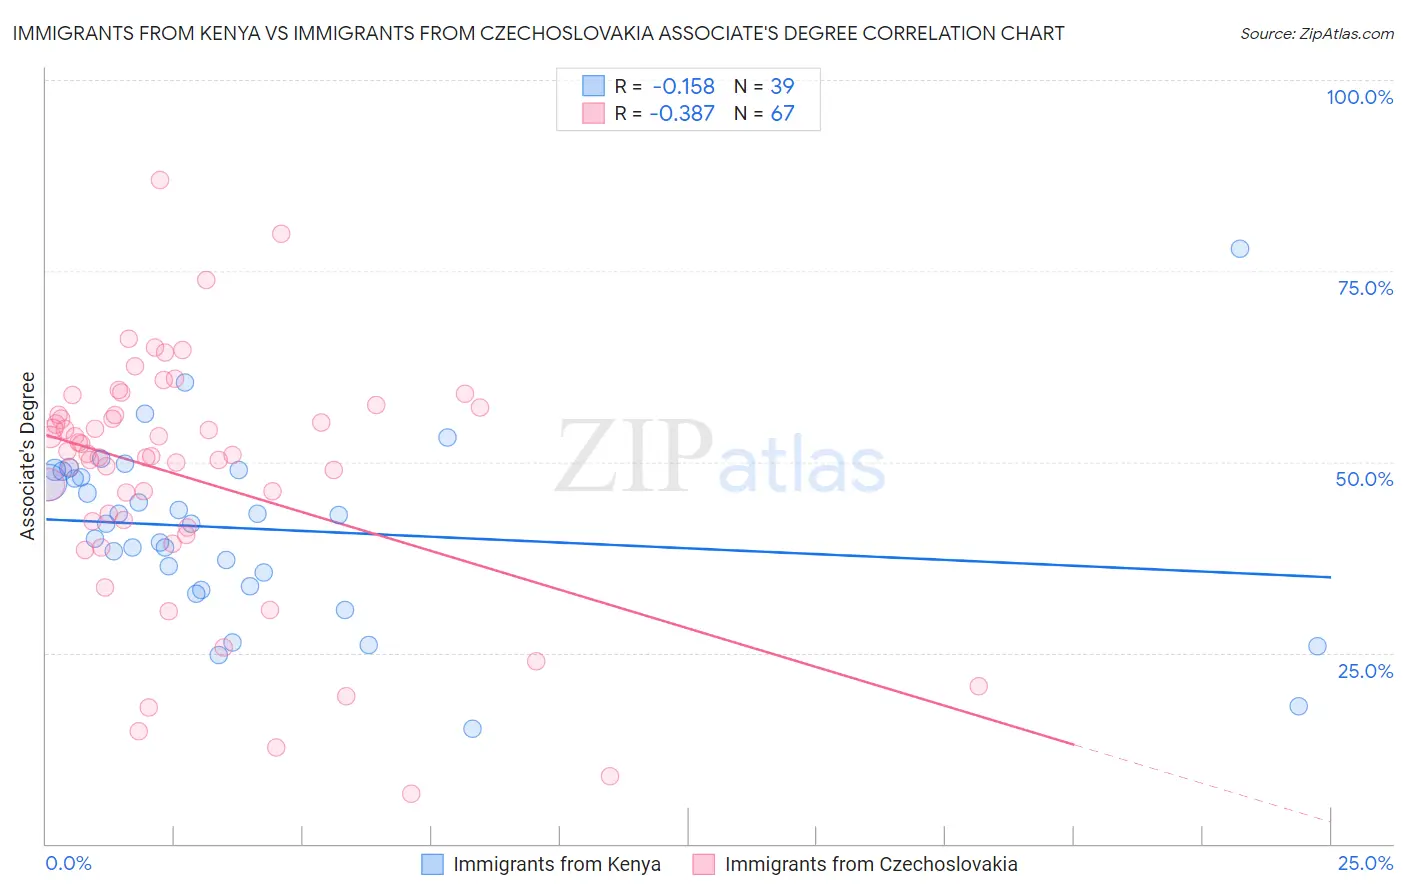
Immigrants from Kenya vs Immigrants from Czechoslovakia Associate's Degree Correlation Chart
The statistical analysis conducted on geographies consisting of 218,082,040 people shows a poor negative correlation between the proportion of Immigrants from Kenya and percentage of population with at least associate's degree education in the United States with a correlation coefficient (R) of -0.158 and weighted average of 47.2%. Similarly, the statistical analysis conducted on geographies consisting of 195,448,477 people shows a mild negative correlation between the proportion of Immigrants from Czechoslovakia and percentage of population with at least associate's degree education in the United States with a correlation coefficient (R) of -0.387 and weighted average of 51.9%, a difference of 10.0%.
Associate's Degree Correlation Summary
| Measurement | Immigrants from Kenya | Immigrants from Czechoslovakia |
| Minimum | 15.0% | 6.6% |
| Maximum | 78.0% | 86.9% |
| Range | 63.0% | 80.3% |
| Mean | 41.2% | 47.9% |
| Median | 42.0% | 50.9% |
| Interquartile 25% (IQ1) | 33.7% | 41.4% |
| Interquartile 75% (IQ3) | 48.8% | 56.2% |
| Interquartile Range (IQR) | 15.1% | 14.7% |
| Standard Deviation (Sample) | 11.8% | 15.9% |
| Standard Deviation (Population) | 11.6% | 15.8% |
Similar Demographics by Associate's Degree
Demographics Similar to Immigrants from Kenya by Associate's Degree
In terms of associate's degree, the demographic groups most similar to Immigrants from Kenya are Czech (47.2%, a difference of 0.010%), Kenyan (47.1%, a difference of 0.13%), South American (47.1%, a difference of 0.14%), Sudanese (47.1%, a difference of 0.16%), and Immigrants from Afghanistan (47.3%, a difference of 0.20%).
| Demographics | Rating | Rank | Associate's Degree |
| Danes | 77.3 /100 | #147 | Good 47.4% |
| South American Indians | 76.7 /100 | #148 | Good 47.4% |
| Immigrants | Armenia | 76.6 /100 | #149 | Good 47.4% |
| Iraqis | 76.2 /100 | #150 | Good 47.4% |
| Immigrants | North Macedonia | 76.0 /100 | #151 | Good 47.4% |
| Immigrants | Afghanistan | 74.3 /100 | #152 | Good 47.3% |
| Czechs | 72.2 /100 | #153 | Good 47.2% |
| Immigrants | Kenya | 72.1 /100 | #154 | Good 47.2% |
| Kenyans | 70.6 /100 | #155 | Good 47.1% |
| South Americans | 70.5 /100 | #156 | Good 47.1% |
| Sudanese | 70.3 /100 | #157 | Good 47.1% |
| Immigrants | Germany | 69.7 /100 | #158 | Good 47.1% |
| Immigrants | Poland | 69.2 /100 | #159 | Good 47.1% |
| Scottish | 65.4 /100 | #160 | Good 46.9% |
| Scandinavians | 65.2 /100 | #161 | Good 46.9% |
Demographics Similar to Immigrants from Czechoslovakia by Associate's Degree
In terms of associate's degree, the demographic groups most similar to Immigrants from Czechoslovakia are Australian (51.9%, a difference of 0.020%), Immigrants from Spain (51.9%, a difference of 0.050%), Paraguayan (51.8%, a difference of 0.12%), Immigrants from Asia (52.0%, a difference of 0.15%), and New Zealander (51.8%, a difference of 0.15%).
| Demographics | Rating | Rank | Associate's Degree |
| Immigrants | Austria | 99.9 /100 | #49 | Exceptional 52.1% |
| Asians | 99.9 /100 | #50 | Exceptional 52.1% |
| Immigrants | Greece | 99.9 /100 | #51 | Exceptional 52.1% |
| Bolivians | 99.8 /100 | #52 | Exceptional 52.0% |
| Immigrants | Asia | 99.8 /100 | #53 | Exceptional 52.0% |
| Immigrants | Spain | 99.8 /100 | #54 | Exceptional 51.9% |
| Australians | 99.8 /100 | #55 | Exceptional 51.9% |
| Immigrants | Czechoslovakia | 99.8 /100 | #56 | Exceptional 51.9% |
| Paraguayans | 99.8 /100 | #57 | Exceptional 51.8% |
| New Zealanders | 99.8 /100 | #58 | Exceptional 51.8% |
| Immigrants | Serbia | 99.8 /100 | #59 | Exceptional 51.7% |
| Immigrants | Bolivia | 99.7 /100 | #60 | Exceptional 51.5% |
| Immigrants | Kazakhstan | 99.7 /100 | #61 | Exceptional 51.4% |
| Bhutanese | 99.7 /100 | #62 | Exceptional 51.4% |
| South Africans | 99.7 /100 | #63 | Exceptional 51.4% |