Yugoslavian vs Immigrants from Czechoslovakia Master's Degree

COMPARE

Yugoslavian
Race
Ancestry
AfghanAfricanAlaska NativeAlaskan AthabascanAlbanianAleutAlsatianAmericanApacheArabArapahoArgentineanArmenianAssyrian/Chaldean/SyriacAustralianAustrianBahamianBangladeshiBarbadianBasqueBelgianBelizeanBermudanBhutaneseBlackfeetBolivianBrazilianBritishBritish West IndianBulgarianBurmeseCajunCambodianCanadianCape VerdeanCarpatho RusynCelticCentral AmericanCentral American IndianCherokeeCheyenneChickasawChileanChineseChippewaChoctawColombianColvilleComancheCosta RicanCreeCreekCroatianCrowCubanCypriotCzechCzechoslovakianDanishDelawareDominicanDutchDutch West IndianEastern EuropeanEcuadorianEgyptianEnglishEstonianEthiopianEuropeanFijianFilipinoFinnishFrenchFrench American IndianFrench CanadianGermanGerman RussianGhanaianGreekGuamanian/ChamorroGuatemalanGuyaneseHaitianHmongHonduranHopiHoumaHungarianIcelanderIndian (Asian)IndonesianInupiatIranianIraqiIrishIroquoisIsraeliItalianJamaicanJapaneseJordanianKenyanKiowaKoreanLaotianLatvianLebaneseLiberianLithuanianLumbeeLuxembourgerMacedonianMalaysianMalteseMarshalleseMenomineeMexicanMexican American IndianMongolianMoroccanNative HawaiianNavajoNepaleseNew ZealanderNicaraguanNigerianNorthern EuropeanNorwegianOkinawanOsageOttawaPaiutePakistaniPalestinianPanamanianParaguayanPennsylvania GermanPeruvianPimaPolishPortuguesePotawatomiPuebloPuerto RicanPuget Sound SalishRomanianRussianSalvadoranSamoanScandinavianScotch-IrishScottishSeminoleSenegaleseSerbianShoshoneSierra LeoneanSiouxSlavicSlovakSloveneSomaliSouth AfricanSouth AmericanSouth American IndianSoviet UnionSpaniardSpanishSpanish AmericanSpanish American IndianSri LankanSubsaharan AfricanSudaneseSwedishSwissSyrianTaiwaneseThaiTlingit-HaidaTohono O'OdhamTonganTrinidadian and TobagonianTsimshianTurkishU.S. Virgin IslanderUgandanUkrainianUruguayanUteVenezuelanVietnameseWelshWest IndianYakamaYaquiYugoslavianYumanYup'ikZimbabwean
Immigration
NonimmigrantsImmigrantsAfghanistanAfricaAlbaniaArgentinaArmeniaAsiaAustraliaAustriaBahamasBangladeshBarbadosBelarusBelgiumBelizeBoliviaBosnia and HerzegovinaBrazilBulgariaBurma/MyanmarCabo VerdeCambodiaCameroonCanadaCaribbeanCentral AmericaChileChinaColombiaCongoCosta RicaCroatiaCubaDenmarkDominicaDominican RepublicEastern AfricaEastern AsiaEastern EuropeEcuadorEgyptEl SalvadorEnglandEritreaEthiopiaEuropeFijiFranceGermanyGhanaGreeceGrenadaGuatemalaGuyanaHaitiHondurasHong KongHungaryIndiaIndonesiaIranIraqIrelandIsraelItalyJamaicaJapanJordanKazakhstanKenyaKoreaKuwaitLaosLatin AmericaLatviaLebanonLiberiaLithuaniaMalaysiaMexicoMicronesiaMiddle AfricaMoldovaMoroccoNepalNetherlandsNicaraguaNigeriaNorth AmericaNorth MacedoniaNorthern AfricaNorthern EuropeNorwayOceaniaPakistanPanamaPeruPhilippinesPolandPortugalRomaniaRussiaSaudi ArabiaScotlandSenegalSerbiaSierra LeoneSingaporeSomaliaSouth AfricaSouth AmericaSouth Central AsiaSouth Eastern AsiaSouthern EuropeSpainSri LankaSt. Vincent and the GrenadinesSudanSwedenSwitzerlandSyriaTaiwanThailandTrinidad and TobagoTurkeyUgandaUkraineUruguayUzbekistanVenezuelaVietnamWest IndiesWestern AfricaWestern AsiaWestern EuropeYemenZaireZimbabweAzores
Immigrants from Czechoslovakia
Race
Ancestry
AfghanAfricanAlaska NativeAlaskan AthabascanAlbanianAleutAlsatianAmericanApacheArabArapahoArgentineanArmenianAssyrian/Chaldean/SyriacAustralianAustrianBahamianBangladeshiBarbadianBasqueBelgianBelizeanBermudanBhutaneseBlackfeetBolivianBrazilianBritishBritish West IndianBulgarianBurmeseCajunCambodianCanadianCape VerdeanCarpatho RusynCelticCentral AmericanCentral American IndianCherokeeCheyenneChickasawChileanChineseChippewaChoctawColombianColvilleComancheCosta RicanCreeCreekCroatianCrowCubanCypriotCzechCzechoslovakianDanishDelawareDominicanDutchDutch West IndianEastern EuropeanEcuadorianEgyptianEnglishEstonianEthiopianEuropeanFijianFilipinoFinnishFrenchFrench American IndianFrench CanadianGermanGerman RussianGhanaianGreekGuamanian/ChamorroGuatemalanGuyaneseHaitianHmongHonduranHopiHoumaHungarianIcelanderIndian (Asian)IndonesianInupiatIranianIraqiIrishIroquoisIsraeliItalianJamaicanJapaneseJordanianKenyanKiowaKoreanLaotianLatvianLebaneseLiberianLithuanianLumbeeLuxembourgerMacedonianMalaysianMalteseMarshalleseMenomineeMexicanMexican American IndianMongolianMoroccanNative HawaiianNavajoNepaleseNew ZealanderNicaraguanNigerianNorthern EuropeanNorwegianOkinawanOsageOttawaPaiutePakistaniPalestinianPanamanianParaguayanPennsylvania GermanPeruvianPimaPolishPortuguesePotawatomiPuebloPuerto RicanPuget Sound SalishRomanianRussianSalvadoranSamoanScandinavianScotch-IrishScottishSeminoleSenegaleseSerbianShoshoneSierra LeoneanSiouxSlavicSlovakSloveneSomaliSouth AfricanSouth AmericanSouth American IndianSoviet UnionSpaniardSpanishSpanish AmericanSpanish American IndianSri LankanSubsaharan AfricanSudaneseSwedishSwissSyrianTaiwaneseThaiTlingit-HaidaTohono O'OdhamTonganTrinidadian and TobagonianTsimshianTurkishU.S. Virgin IslanderUgandanUkrainianUruguayanUteVenezuelanVietnameseWelshWest IndianYakamaYaquiYumanYup'ikZimbabwean
Immigration
NonimmigrantsImmigrantsAfghanistanAfricaAlbaniaArgentinaArmeniaAsiaAustraliaAustriaBahamasBangladeshBarbadosBelarusBelgiumBelizeBoliviaBosnia and HerzegovinaBrazilBulgariaBurma/MyanmarCabo VerdeCambodiaCameroonCanadaCaribbeanCentral AmericaChileChinaColombiaCongoCosta RicaCroatiaCubaCzechoslovakiaDenmarkDominicaDominican RepublicEastern AfricaEastern AsiaEastern EuropeEcuadorEgyptEl SalvadorEnglandEritreaEthiopiaEuropeFijiFranceGermanyGhanaGreeceGrenadaGuatemalaGuyanaHaitiHondurasHong KongHungaryIndiaIndonesiaIranIraqIrelandIsraelItalyJamaicaJapanJordanKazakhstanKenyaKoreaKuwaitLaosLatin AmericaLatviaLebanonLiberiaLithuaniaMalaysiaMexicoMicronesiaMiddle AfricaMoldovaMoroccoNepalNetherlandsNicaraguaNigeriaNorth AmericaNorth MacedoniaNorthern AfricaNorthern EuropeNorwayOceaniaPakistanPanamaPeruPhilippinesPolandPortugalRomaniaRussiaSaudi ArabiaScotlandSenegalSerbiaSierra LeoneSingaporeSomaliaSouth AfricaSouth AmericaSouth Central AsiaSouth Eastern AsiaSouthern EuropeSpainSri LankaSt. Vincent and the GrenadinesSudanSwedenSwitzerlandSyriaTaiwanThailandTrinidad and TobagoTurkeyUgandaUkraineUruguayUzbekistanVenezuelaVietnamWest IndiesWestern AfricaWestern AsiaWestern EuropeYemenZaireZimbabweAzores
Master's Degree
Income
Poverty
Unemployment
Labor Participation
Family Structure
Vehicle Availability
Education Level
Disability

Master's Degree Comparison

Yugoslavians

Immigrants from Czechoslovakia

Fair
Exceptional
14.4%
MASTER'S DEGREE
24.3/ 100
METRIC RATING
203rd/ 347
METRIC RANK
18.5%
MASTER'S DEGREE
99.9/ 100
METRIC RATING
53rd/ 347
METRIC RANK

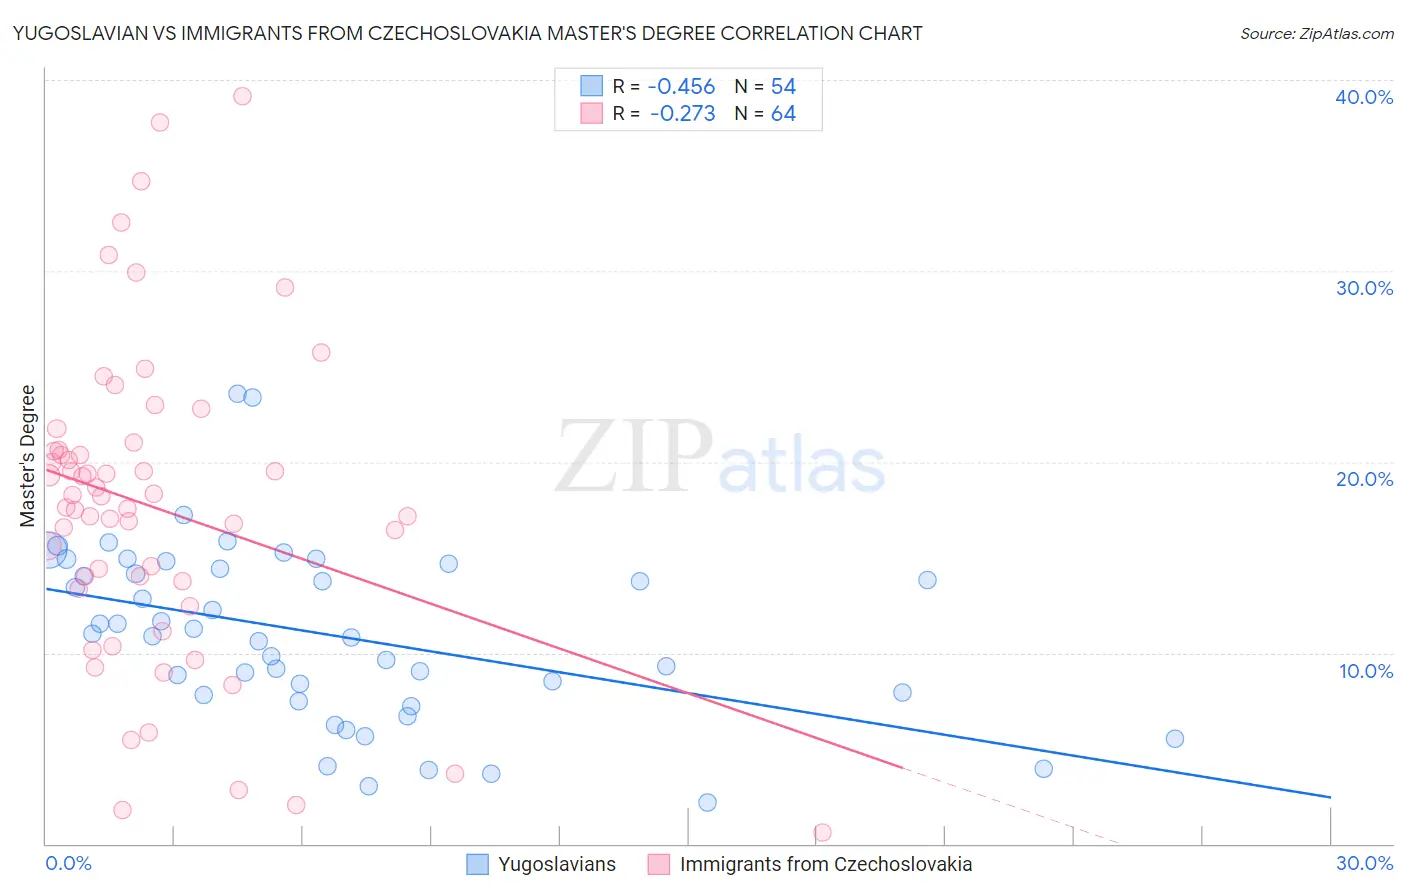
Yugoslavian vs Immigrants from Czechoslovakia Master's Degree Correlation Chart

The statistical analysis conducted on geographies consisting of 285,661,106 people shows a moderate negative correlation between the proportion of Yugoslavians and percentage of population with at least master's degree education in the United States with a correlation coefficient (R) of -0.456 and weighted average of 14.4%. Similarly, the statistical analysis conducted on geographies consisting of 195,445,199 people shows a weak negative correlation between the proportion of Immigrants from Czechoslovakia and percentage of population with at least master's degree education in the United States with a correlation coefficient (R) of -0.273 and weighted average of 18.5%, a difference of 29.0%.
Yugoslavian vs Immigrants from Czechoslovakia Master's Degree

Master's Degree Correlation Summary

MeasurementYugoslavianImmigrants from Czechoslovakia
Minimum2.2%0.60%
Maximum23.6%39.2%
Range21.4%38.6%
Mean10.9%17.6%
Median10.9%17.9%
Interquartile 25% (IQ1)7.8%13.6%
Interquartile 75% (IQ3)14.4%20.6%
Interquartile Range (IQR)6.6%7.0%
Standard Deviation (Sample)4.7%8.2%
Standard Deviation (Population)4.6%8.1%

Similar Demographics by Master's Degree

Demographics Similar to Yugoslavians by Master's Degree

In terms of master's degree, the demographic groups most similar to Yugoslavians are Immigrants from Western Africa (14.4%, a difference of 0.11%), French (14.4%, a difference of 0.11%), Panamanian (14.4%, a difference of 0.13%), Scotch-Irish (14.4%, a difference of 0.13%), and Trinidadian and Tobagonian (14.4%, a difference of 0.15%).
DemographicsRating | RankMaster's Degree
Czechoslovakians
29.9
/100
|
#196
Fair
14.5%
Belgians
28.0
/100
|
#197
Fair
14.5%
West Indians
27.4
/100
|
#198
Fair
14.5%
Immigrants | Armenia
27.2
/100
|
#199
Fair
14.5%
Panamanians
25.1
/100
|
#200
Fair
14.4%
Scotch-Irish
25.0
/100
|
#201
Fair
14.4%
Immigrants | Western Africa
24.9
/100
|
#202
Fair
14.4%
Yugoslavians
24.3
/100
|
#203
Fair
14.4%
French
23.7
/100
|
#204
Fair
14.4%
Trinidadians and Tobagonians
23.5
/100
|
#205
Fair
14.4%
Scandinavians
23.3
/100
|
#206
Fair
14.4%
Immigrants | Bosnia and Herzegovina
22.0
/100
|
#207
Fair
14.3%
Immigrants | Barbados
20.5
/100
|
#208
Fair
14.3%
Immigrants | Panama
20.0
/100
|
#209
Fair
14.3%
Sub-Saharan Africans
19.4
/100
|
#210
Poor
14.2%

Demographics Similar to Immigrants from Czechoslovakia by Master's Degree

In terms of master's degree, the demographic groups most similar to Immigrants from Czechoslovakia are Immigrants from Kuwait (18.6%, a difference of 0.080%), Immigrants from Lithuania (18.5%, a difference of 0.31%), Immigrants from Serbia (18.5%, a difference of 0.34%), Asian (18.4%, a difference of 0.57%), and Immigrants from Asia (18.4%, a difference of 0.70%).
DemographicsRating | RankMaster's Degree
Immigrants | Norway
100.0
/100
|
#46
Exceptional
18.8%
Immigrants | Austria
100.0
/100
|
#47
Exceptional
18.8%
Paraguayans
100.0
/100
|
#48
Exceptional
18.8%
Estonians
100.0
/100
|
#49
Exceptional
18.8%
Bulgarians
100.0
/100
|
#50
Exceptional
18.8%
Immigrants | South Africa
100.0
/100
|
#51
Exceptional
18.8%
Immigrants | Kuwait
100.0
/100
|
#52
Exceptional
18.6%
Immigrants | Czechoslovakia
99.9
/100
|
#53
Exceptional
18.5%
Immigrants | Lithuania
99.9
/100
|
#54
Exceptional
18.5%
Immigrants | Serbia
99.9
/100
|
#55
Exceptional
18.5%
Asians
99.9
/100
|
#56
Exceptional
18.4%
Immigrants | Asia
99.9
/100
|
#57
Exceptional
18.4%
Australians
99.9
/100
|
#58
Exceptional
18.4%
Immigrants | Bulgaria
99.9
/100
|
#59
Exceptional
18.3%
New Zealanders
99.9
/100
|
#60
Exceptional
18.3%