Yugoslavian vs Basque Associate's Degree
COMPARE
Yugoslavian
Basque
Associate's Degree
Associate's Degree Comparison
Yugoslavians
Basques
46.0%
ASSOCIATE'S DEGREE
40.2/ 100
METRIC RATING
183rd/ 347
METRIC RANK
46.5%
ASSOCIATE'S DEGREE
52.8/ 100
METRIC RATING
171st/ 347
METRIC RANK
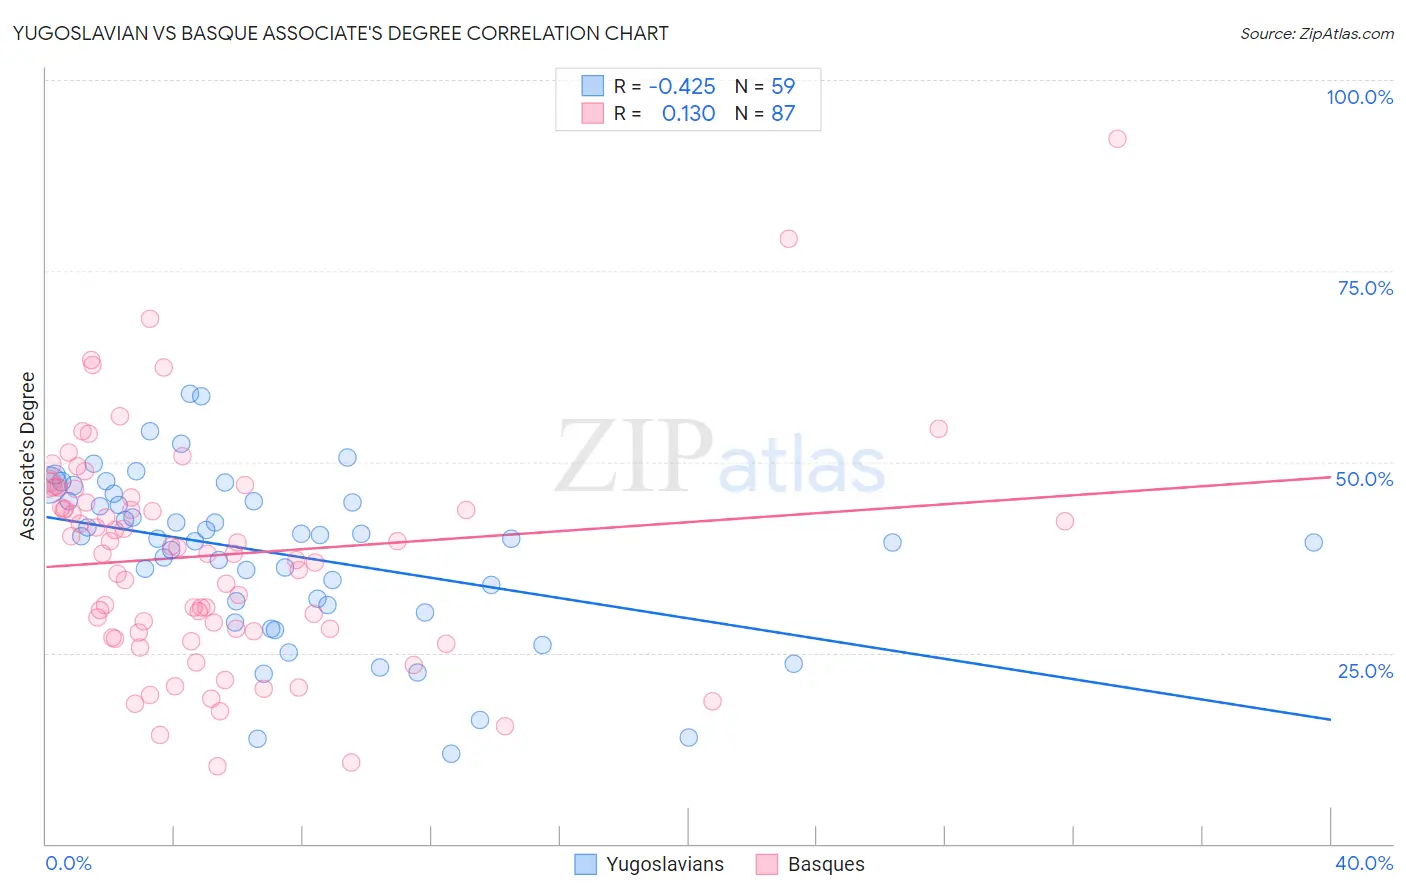
Yugoslavian vs Basque Associate's Degree Correlation Chart
The statistical analysis conducted on geographies consisting of 285,717,072 people shows a moderate negative correlation between the proportion of Yugoslavians and percentage of population with at least associate's degree education in the United States with a correlation coefficient (R) of -0.425 and weighted average of 46.0%. Similarly, the statistical analysis conducted on geographies consisting of 165,778,580 people shows a poor positive correlation between the proportion of Basques and percentage of population with at least associate's degree education in the United States with a correlation coefficient (R) of 0.130 and weighted average of 46.5%, a difference of 0.96%.
Associate's Degree Correlation Summary
| Measurement | Yugoslavian | Basque |
| Minimum | 11.8% | 10.2% |
| Maximum | 58.9% | 92.3% |
| Range | 47.2% | 82.1% |
| Mean | 37.9% | 37.8% |
| Median | 40.0% | 38.0% |
| Interquartile 25% (IQ1) | 31.3% | 27.9% |
| Interquartile 75% (IQ3) | 44.9% | 46.5% |
| Interquartile Range (IQR) | 13.6% | 18.6% |
| Standard Deviation (Sample) | 10.8% | 14.5% |
| Standard Deviation (Population) | 10.7% | 14.4% |
Demographics Similar to Yugoslavians and Basques by Associate's Degree
In terms of associate's degree, the demographic groups most similar to Yugoslavians are Swiss (46.0%, a difference of 0.010%), Czechoslovakian (46.0%, a difference of 0.020%), Immigrants from Colombia (46.0%, a difference of 0.080%), Costa Rican (46.0%, a difference of 0.13%), and Welsh (45.9%, a difference of 0.19%). Similarly, the demographic groups most similar to Basques are Irish (46.5%, a difference of 0.060%), Peruvian (46.4%, a difference of 0.18%), Uruguayan (46.5%, a difference of 0.19%), Immigrants from Iraq (46.4%, a difference of 0.19%), and Immigrants from Somalia (46.5%, a difference of 0.20%).
| Demographics | Rating | Rank | Associate's Degree |
| Immigrants | Sierra Leone | 59.2 /100 | #167 | Average 46.7% |
| Immigrants | Somalia | 55.5 /100 | #168 | Average 46.5% |
| Uruguayans | 55.4 /100 | #169 | Average 46.5% |
| Irish | 53.6 /100 | #170 | Average 46.5% |
| Basques | 52.8 /100 | #171 | Average 46.5% |
| Peruvians | 50.5 /100 | #172 | Average 46.4% |
| Immigrants | Iraq | 50.3 /100 | #173 | Average 46.4% |
| English | 50.0 /100 | #174 | Average 46.4% |
| Belgians | 48.9 /100 | #175 | Average 46.3% |
| Finns | 48.5 /100 | #176 | Average 46.3% |
| Slovaks | 48.4 /100 | #177 | Average 46.3% |
| Immigrants | Bosnia and Herzegovina | 48.3 /100 | #178 | Average 46.3% |
| Sri Lankans | 47.6 /100 | #179 | Average 46.3% |
| Bermudans | 46.4 /100 | #180 | Average 46.2% |
| Immigrants | Colombia | 41.3 /100 | #181 | Average 46.0% |
| Swiss | 40.4 /100 | #182 | Average 46.0% |
| Yugoslavians | 40.2 /100 | #183 | Average 46.0% |
| Czechoslovakians | 40.0 /100 | #184 | Average 46.0% |
| Costa Ricans | 38.6 /100 | #185 | Fair 46.0% |
| Welsh | 37.9 /100 | #186 | Fair 45.9% |
| Immigrants | Uruguay | 35.5 /100 | #187 | Fair 45.8% |