Creek vs Immigrants from Czechoslovakia Associate's Degree
COMPARE
Creek
Immigrants from Czechoslovakia
Associate's Degree
Associate's Degree Comparison
Creek
Immigrants from Czechoslovakia
37.6%
ASSOCIATE'S DEGREE
0.0/ 100
METRIC RATING
315th/ 347
METRIC RANK
51.9%
ASSOCIATE'S DEGREE
99.8/ 100
METRIC RATING
56th/ 347
METRIC RANK
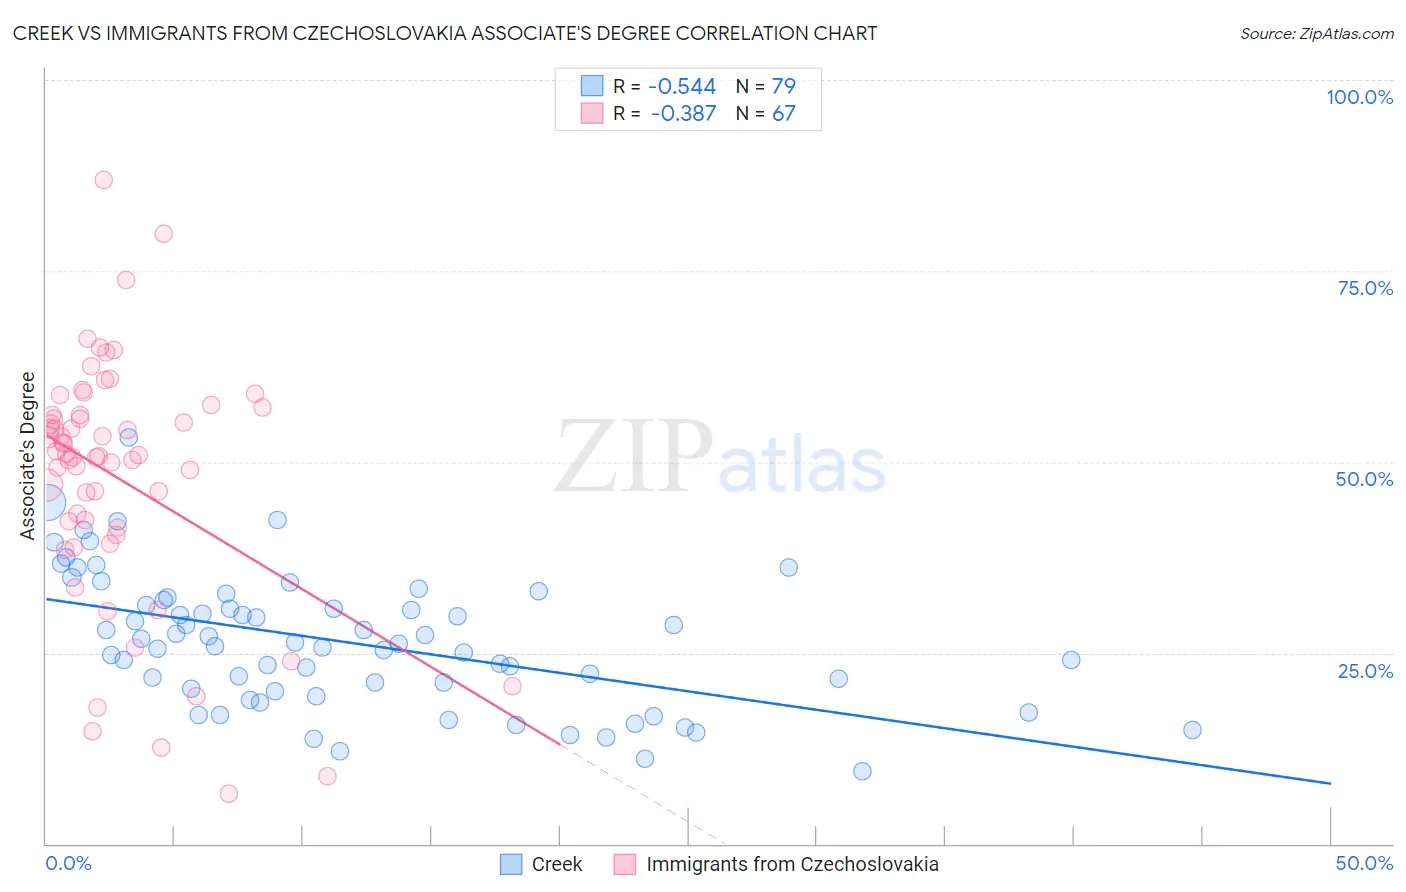
Creek vs Immigrants from Czechoslovakia Associate's Degree Correlation Chart
The statistical analysis conducted on geographies consisting of 178,480,454 people shows a substantial negative correlation between the proportion of Creek and percentage of population with at least associate's degree education in the United States with a correlation coefficient (R) of -0.544 and weighted average of 37.6%. Similarly, the statistical analysis conducted on geographies consisting of 195,448,477 people shows a mild negative correlation between the proportion of Immigrants from Czechoslovakia and percentage of population with at least associate's degree education in the United States with a correlation coefficient (R) of -0.387 and weighted average of 51.9%, a difference of 38.1%.
Associate's Degree Correlation Summary
| Measurement | Creek | Immigrants from Czechoslovakia |
| Minimum | 9.5% | 6.6% |
| Maximum | 53.2% | 86.9% |
| Range | 43.7% | 80.3% |
| Mean | 26.4% | 47.9% |
| Median | 26.2% | 50.9% |
| Interquartile 25% (IQ1) | 20.0% | 41.4% |
| Interquartile 75% (IQ3) | 31.9% | 56.2% |
| Interquartile Range (IQR) | 11.9% | 14.7% |
| Standard Deviation (Sample) | 8.7% | 15.9% |
| Standard Deviation (Population) | 8.7% | 15.8% |
Similar Demographics by Associate's Degree
Demographics Similar to Creek by Associate's Degree
In terms of associate's degree, the demographic groups most similar to Creek are Crow (37.6%, a difference of 0.010%), Yaqui (37.6%, a difference of 0.020%), Alaska Native (37.5%, a difference of 0.26%), Seminole (37.7%, a difference of 0.39%), and Hispanic or Latino (37.7%, a difference of 0.44%).
| Demographics | Rating | Rank | Associate's Degree |
| Mexican American Indians | 0.0 /100 | #308 | Tragic 38.2% |
| Immigrants | Guatemala | 0.0 /100 | #309 | Tragic 38.1% |
| Immigrants | Dominican Republic | 0.0 /100 | #310 | Tragic 37.9% |
| Immigrants | Latin America | 0.0 /100 | #311 | Tragic 37.9% |
| Choctaw | 0.0 /100 | #312 | Tragic 37.8% |
| Hispanics or Latinos | 0.0 /100 | #313 | Tragic 37.7% |
| Seminole | 0.0 /100 | #314 | Tragic 37.7% |
| Creek | 0.0 /100 | #315 | Tragic 37.6% |
| Crow | 0.0 /100 | #316 | Tragic 37.6% |
| Yaqui | 0.0 /100 | #317 | Tragic 37.6% |
| Alaska Natives | 0.0 /100 | #318 | Tragic 37.5% |
| Fijians | 0.0 /100 | #319 | Tragic 37.4% |
| Cajuns | 0.0 /100 | #320 | Tragic 37.4% |
| Immigrants | Yemen | 0.0 /100 | #321 | Tragic 37.3% |
| Pennsylvania Germans | 0.0 /100 | #322 | Tragic 37.2% |
Demographics Similar to Immigrants from Czechoslovakia by Associate's Degree
In terms of associate's degree, the demographic groups most similar to Immigrants from Czechoslovakia are Australian (51.9%, a difference of 0.020%), Immigrants from Spain (51.9%, a difference of 0.050%), Paraguayan (51.8%, a difference of 0.12%), Immigrants from Asia (52.0%, a difference of 0.15%), and New Zealander (51.8%, a difference of 0.15%).
| Demographics | Rating | Rank | Associate's Degree |
| Immigrants | Austria | 99.9 /100 | #49 | Exceptional 52.1% |
| Asians | 99.9 /100 | #50 | Exceptional 52.1% |
| Immigrants | Greece | 99.9 /100 | #51 | Exceptional 52.1% |
| Bolivians | 99.8 /100 | #52 | Exceptional 52.0% |
| Immigrants | Asia | 99.8 /100 | #53 | Exceptional 52.0% |
| Immigrants | Spain | 99.8 /100 | #54 | Exceptional 51.9% |
| Australians | 99.8 /100 | #55 | Exceptional 51.9% |
| Immigrants | Czechoslovakia | 99.8 /100 | #56 | Exceptional 51.9% |
| Paraguayans | 99.8 /100 | #57 | Exceptional 51.8% |
| New Zealanders | 99.8 /100 | #58 | Exceptional 51.8% |
| Immigrants | Serbia | 99.8 /100 | #59 | Exceptional 51.7% |
| Immigrants | Bolivia | 99.7 /100 | #60 | Exceptional 51.5% |
| Immigrants | Kazakhstan | 99.7 /100 | #61 | Exceptional 51.4% |
| Bhutanese | 99.7 /100 | #62 | Exceptional 51.4% |
| South Africans | 99.7 /100 | #63 | Exceptional 51.4% |