Yugoslavian vs Eastern European Associate's Degree
COMPARE
Yugoslavian
Eastern European
Associate's Degree
Associate's Degree Comparison
Yugoslavians
Eastern Europeans
46.0%
ASSOCIATE'S DEGREE
40.2/ 100
METRIC RATING
183rd/ 347
METRIC RANK
55.0%
ASSOCIATE'S DEGREE
100.0/ 100
METRIC RATING
17th/ 347
METRIC RANK
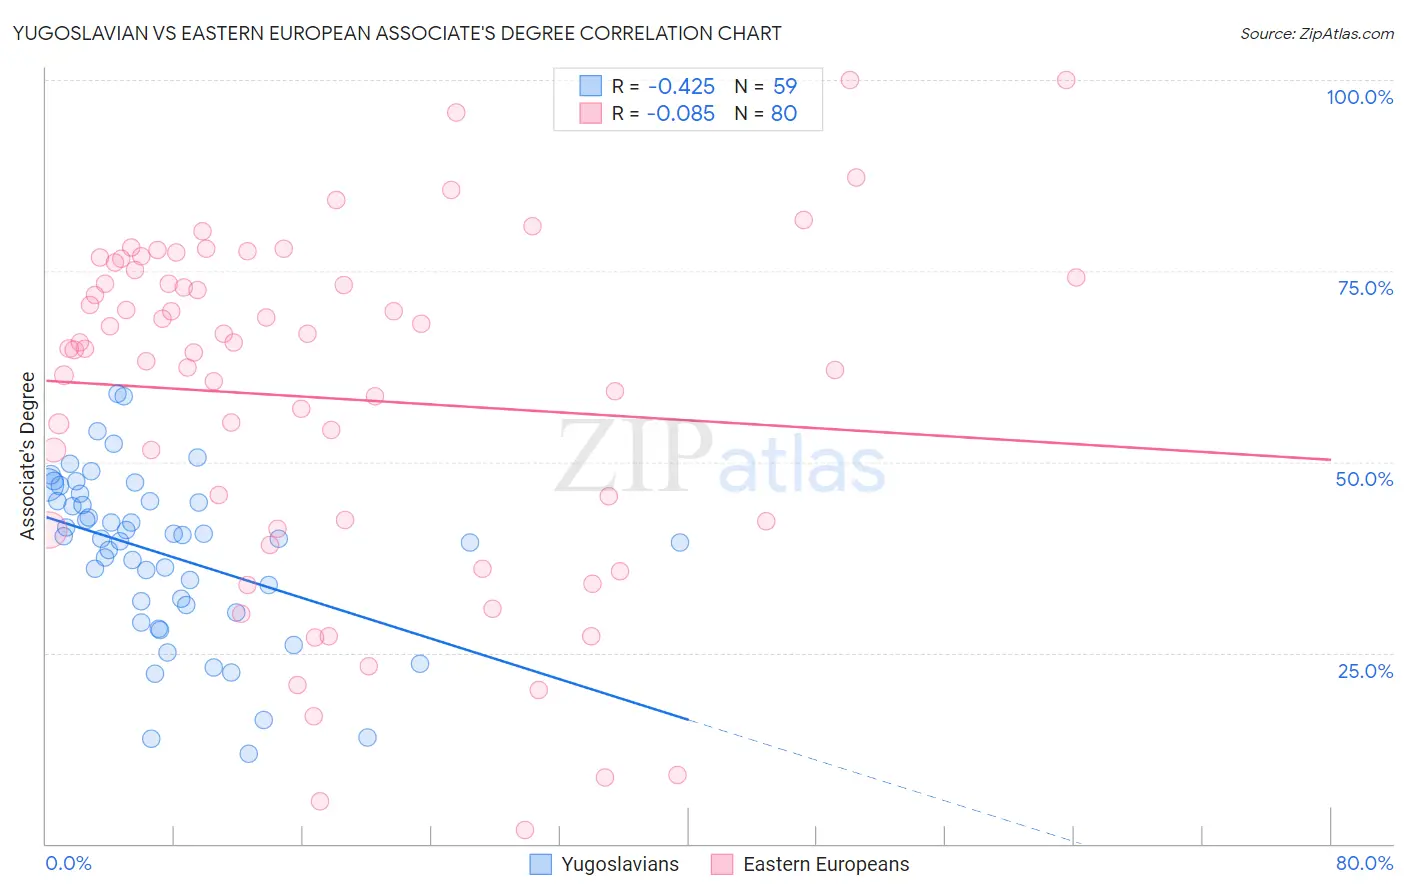
Yugoslavian vs Eastern European Associate's Degree Correlation Chart
The statistical analysis conducted on geographies consisting of 285,717,072 people shows a moderate negative correlation between the proportion of Yugoslavians and percentage of population with at least associate's degree education in the United States with a correlation coefficient (R) of -0.425 and weighted average of 46.0%. Similarly, the statistical analysis conducted on geographies consisting of 461,211,672 people shows a slight negative correlation between the proportion of Eastern Europeans and percentage of population with at least associate's degree education in the United States with a correlation coefficient (R) of -0.085 and weighted average of 55.0%, a difference of 19.6%.
Associate's Degree Correlation Summary
| Measurement | Yugoslavian | Eastern European |
| Minimum | 11.8% | 1.8% |
| Maximum | 58.9% | 100.0% |
| Range | 47.2% | 98.2% |
| Mean | 37.9% | 58.3% |
| Median | 40.0% | 64.8% |
| Interquartile 25% (IQ1) | 31.3% | 41.8% |
| Interquartile 75% (IQ3) | 44.9% | 74.6% |
| Interquartile Range (IQR) | 13.6% | 32.9% |
| Standard Deviation (Sample) | 10.8% | 22.7% |
| Standard Deviation (Population) | 10.7% | 22.6% |
Similar Demographics by Associate's Degree
Demographics Similar to Yugoslavians by Associate's Degree
In terms of associate's degree, the demographic groups most similar to Yugoslavians are Swiss (46.0%, a difference of 0.010%), Czechoslovakian (46.0%, a difference of 0.020%), Immigrants from Colombia (46.0%, a difference of 0.080%), Costa Rican (46.0%, a difference of 0.13%), and Welsh (45.9%, a difference of 0.19%).
| Demographics | Rating | Rank | Associate's Degree |
| Finns | 48.5 /100 | #176 | Average 46.3% |
| Slovaks | 48.4 /100 | #177 | Average 46.3% |
| Immigrants | Bosnia and Herzegovina | 48.3 /100 | #178 | Average 46.3% |
| Sri Lankans | 47.6 /100 | #179 | Average 46.3% |
| Bermudans | 46.4 /100 | #180 | Average 46.2% |
| Immigrants | Colombia | 41.3 /100 | #181 | Average 46.0% |
| Swiss | 40.4 /100 | #182 | Average 46.0% |
| Yugoslavians | 40.2 /100 | #183 | Average 46.0% |
| Czechoslovakians | 40.0 /100 | #184 | Average 46.0% |
| Costa Ricans | 38.6 /100 | #185 | Fair 46.0% |
| Welsh | 37.9 /100 | #186 | Fair 45.9% |
| Immigrants | Uruguay | 35.5 /100 | #187 | Fair 45.8% |
| Ghanaians | 35.5 /100 | #188 | Fair 45.8% |
| Immigrants | Oceania | 34.7 /100 | #189 | Fair 45.8% |
| Vietnamese | 34.0 /100 | #190 | Fair 45.8% |
Demographics Similar to Eastern Europeans by Associate's Degree
In terms of associate's degree, the demographic groups most similar to Eastern Europeans are Soviet Union (55.1%, a difference of 0.14%), Indian (Asian) (54.8%, a difference of 0.48%), Immigrants from Eastern Asia (55.4%, a difference of 0.61%), Immigrants from Hong Kong (55.4%, a difference of 0.64%), and Immigrants from Ireland (54.7%, a difference of 0.70%).
| Demographics | Rating | Rank | Associate's Degree |
| Cypriots | 100.0 /100 | #10 | Exceptional 56.4% |
| Immigrants | Australia | 100.0 /100 | #11 | Exceptional 55.8% |
| Immigrants | South Central Asia | 100.0 /100 | #12 | Exceptional 55.7% |
| Immigrants | China | 100.0 /100 | #13 | Exceptional 55.5% |
| Immigrants | Hong Kong | 100.0 /100 | #14 | Exceptional 55.4% |
| Immigrants | Eastern Asia | 100.0 /100 | #15 | Exceptional 55.4% |
| Soviet Union | 100.0 /100 | #16 | Exceptional 55.1% |
| Eastern Europeans | 100.0 /100 | #17 | Exceptional 55.0% |
| Indians (Asian) | 100.0 /100 | #18 | Exceptional 54.8% |
| Immigrants | Ireland | 100.0 /100 | #19 | Exceptional 54.7% |
| Cambodians | 100.0 /100 | #20 | Exceptional 54.6% |
| Immigrants | Sweden | 100.0 /100 | #21 | Exceptional 54.6% |
| Immigrants | Japan | 100.0 /100 | #22 | Exceptional 54.6% |
| Burmese | 100.0 /100 | #23 | Exceptional 54.6% |
| Immigrants | Korea | 100.0 /100 | #24 | Exceptional 54.5% |