German Russian vs Immigrants from Czechoslovakia Associate's Degree
COMPARE
German Russian
Immigrants from Czechoslovakia
Associate's Degree
Associate's Degree Comparison
German Russians
Immigrants from Czechoslovakia
45.1%
ASSOCIATE'S DEGREE
18.9/ 100
METRIC RATING
206th/ 347
METRIC RANK
51.9%
ASSOCIATE'S DEGREE
99.8/ 100
METRIC RATING
56th/ 347
METRIC RANK
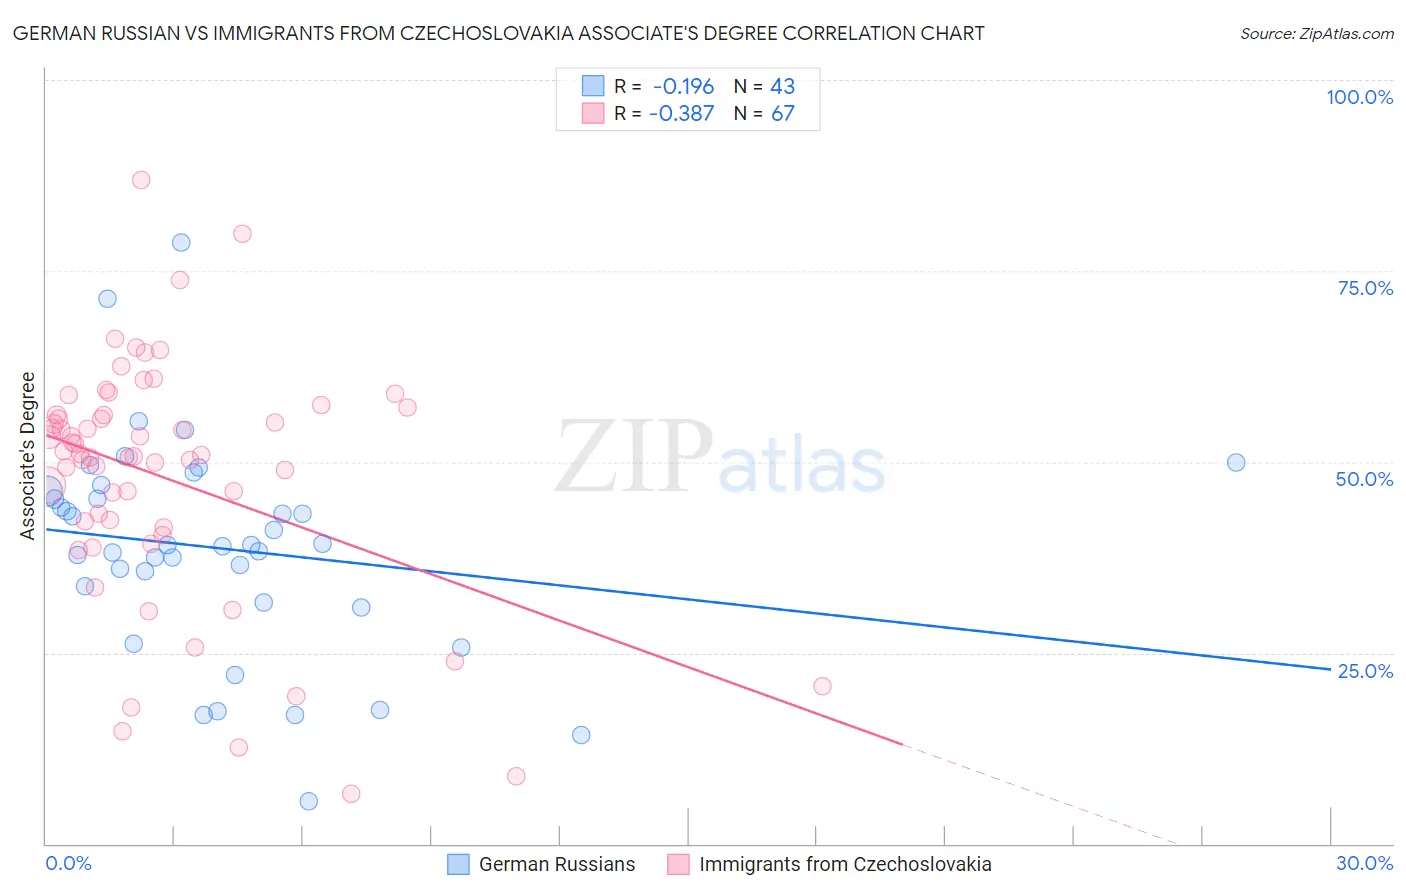
German Russian vs Immigrants from Czechoslovakia Associate's Degree Correlation Chart
The statistical analysis conducted on geographies consisting of 96,460,905 people shows a poor negative correlation between the proportion of German Russians and percentage of population with at least associate's degree education in the United States with a correlation coefficient (R) of -0.196 and weighted average of 45.1%. Similarly, the statistical analysis conducted on geographies consisting of 195,448,477 people shows a mild negative correlation between the proportion of Immigrants from Czechoslovakia and percentage of population with at least associate's degree education in the United States with a correlation coefficient (R) of -0.387 and weighted average of 51.9%, a difference of 15.1%.
Associate's Degree Correlation Summary
| Measurement | German Russian | Immigrants from Czechoslovakia |
| Minimum | 5.6% | 6.6% |
| Maximum | 78.7% | 86.9% |
| Range | 73.1% | 80.3% |
| Mean | 38.6% | 47.9% |
| Median | 39.1% | 50.9% |
| Interquartile 25% (IQ1) | 31.5% | 41.4% |
| Interquartile 75% (IQ3) | 46.2% | 56.2% |
| Interquartile Range (IQR) | 14.6% | 14.7% |
| Standard Deviation (Sample) | 14.2% | 15.9% |
| Standard Deviation (Population) | 14.0% | 15.8% |
Similar Demographics by Associate's Degree
Demographics Similar to German Russians by Associate's Degree
In terms of associate's degree, the demographic groups most similar to German Russians are Immigrants from Thailand (45.1%, a difference of 0.0%), Nigerian (45.1%, a difference of 0.030%), Panamanian (45.1%, a difference of 0.070%), Immigrants from South Eastern Asia (45.2%, a difference of 0.17%), and Dutch (45.0%, a difference of 0.17%).
| Demographics | Rating | Rank | Associate's Degree |
| Immigrants | Senegal | 21.2 /100 | #199 | Fair 45.2% |
| Senegalese | 21.1 /100 | #200 | Fair 45.2% |
| Immigrants | Vietnam | 20.8 /100 | #201 | Fair 45.2% |
| Spaniards | 20.4 /100 | #202 | Fair 45.2% |
| Immigrants | South Eastern Asia | 20.2 /100 | #203 | Fair 45.2% |
| Nigerians | 19.1 /100 | #204 | Poor 45.1% |
| Immigrants | Thailand | 18.9 /100 | #205 | Poor 45.1% |
| German Russians | 18.9 /100 | #206 | Poor 45.1% |
| Panamanians | 18.4 /100 | #207 | Poor 45.1% |
| Dutch | 17.6 /100 | #208 | Poor 45.0% |
| Immigrants | Costa Rica | 16.7 /100 | #209 | Poor 45.0% |
| Immigrants | Philippines | 16.7 /100 | #210 | Poor 45.0% |
| Immigrants | Zaire | 16.6 /100 | #211 | Poor 45.0% |
| French Canadians | 15.0 /100 | #212 | Poor 44.9% |
| Immigrants | Ghana | 14.2 /100 | #213 | Poor 44.8% |
Demographics Similar to Immigrants from Czechoslovakia by Associate's Degree
In terms of associate's degree, the demographic groups most similar to Immigrants from Czechoslovakia are Australian (51.9%, a difference of 0.020%), Immigrants from Spain (51.9%, a difference of 0.050%), Paraguayan (51.8%, a difference of 0.12%), Immigrants from Asia (52.0%, a difference of 0.15%), and New Zealander (51.8%, a difference of 0.15%).
| Demographics | Rating | Rank | Associate's Degree |
| Immigrants | Austria | 99.9 /100 | #49 | Exceptional 52.1% |
| Asians | 99.9 /100 | #50 | Exceptional 52.1% |
| Immigrants | Greece | 99.9 /100 | #51 | Exceptional 52.1% |
| Bolivians | 99.8 /100 | #52 | Exceptional 52.0% |
| Immigrants | Asia | 99.8 /100 | #53 | Exceptional 52.0% |
| Immigrants | Spain | 99.8 /100 | #54 | Exceptional 51.9% |
| Australians | 99.8 /100 | #55 | Exceptional 51.9% |
| Immigrants | Czechoslovakia | 99.8 /100 | #56 | Exceptional 51.9% |
| Paraguayans | 99.8 /100 | #57 | Exceptional 51.8% |
| New Zealanders | 99.8 /100 | #58 | Exceptional 51.8% |
| Immigrants | Serbia | 99.8 /100 | #59 | Exceptional 51.7% |
| Immigrants | Bolivia | 99.7 /100 | #60 | Exceptional 51.5% |
| Immigrants | Kazakhstan | 99.7 /100 | #61 | Exceptional 51.4% |
| Bhutanese | 99.7 /100 | #62 | Exceptional 51.4% |
| South Africans | 99.7 /100 | #63 | Exceptional 51.4% |