Yaqui vs Immigrants from Senegal 3rd Grade
COMPARE
Yaqui
Immigrants from Senegal
3rd Grade
3rd Grade Comparison
Yaqui
Immigrants from Senegal
97.3%
3RD GRADE
0.3/ 100
METRIC RATING
266th/ 347
METRIC RANK
97.4%
3RD GRADE
1.0/ 100
METRIC RATING
246th/ 347
METRIC RANK
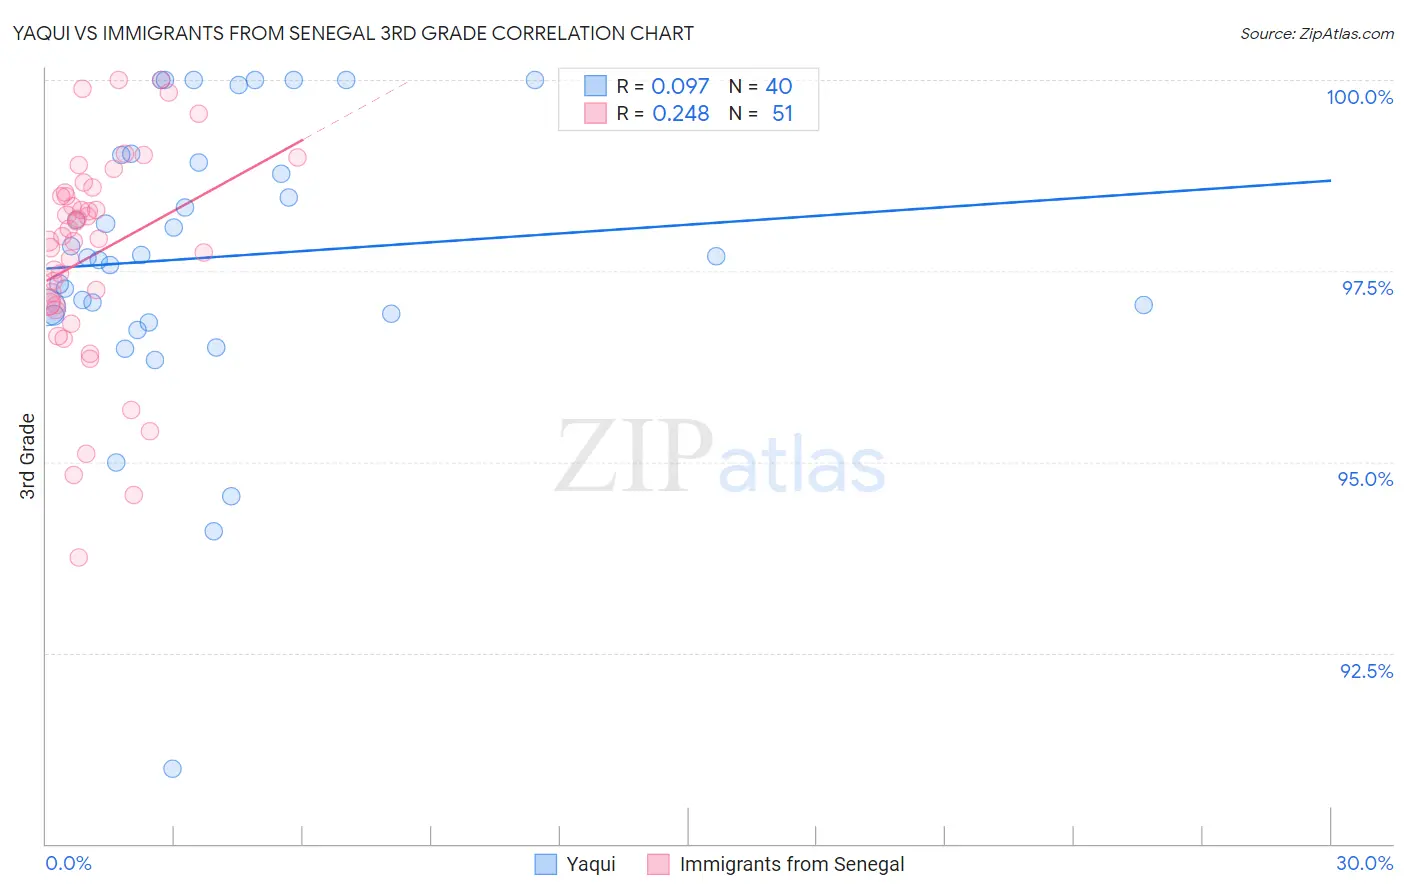
Yaqui vs Immigrants from Senegal 3rd Grade Correlation Chart
The statistical analysis conducted on geographies consisting of 107,732,380 people shows a slight positive correlation between the proportion of Yaqui and percentage of population with at least 3rd grade education in the United States with a correlation coefficient (R) of 0.097 and weighted average of 97.3%. Similarly, the statistical analysis conducted on geographies consisting of 90,126,273 people shows a weak positive correlation between the proportion of Immigrants from Senegal and percentage of population with at least 3rd grade education in the United States with a correlation coefficient (R) of 0.248 and weighted average of 97.4%, a difference of 0.12%.
3rd Grade Correlation Summary
| Measurement | Yaqui | Immigrants from Senegal |
| Minimum | 91.0% | 93.7% |
| Maximum | 100.0% | 100.0% |
| Range | 9.0% | 6.3% |
| Mean | 97.7% | 97.7% |
| Median | 97.7% | 97.9% |
| Interquartile 25% (IQ1) | 96.9% | 97.1% |
| Interquartile 75% (IQ3) | 99.0% | 98.5% |
| Interquartile Range (IQR) | 2.0% | 1.5% |
| Standard Deviation (Sample) | 1.9% | 1.4% |
| Standard Deviation (Population) | 1.8% | 1.4% |
Demographics Similar to Yaqui and Immigrants from Senegal by 3rd Grade
In terms of 3rd grade, the demographic groups most similar to Yaqui are Immigrants from Jamaica (97.3%, a difference of 0.010%), Taiwanese (97.3%, a difference of 0.020%), West Indian (97.3%, a difference of 0.020%), Immigrants from South America (97.3%, a difference of 0.030%), and Immigrants from Sierra Leone (97.3%, a difference of 0.030%). Similarly, the demographic groups most similar to Immigrants from Senegal are Assyrian/Chaldean/Syriac (97.4%, a difference of 0.0%), Immigrants from Eastern Africa (97.4%, a difference of 0.010%), South American (97.4%, a difference of 0.010%), Immigrants from Middle Africa (97.4%, a difference of 0.010%), and Immigrants from Asia (97.4%, a difference of 0.010%).
| Demographics | Rating | Rank | 3rd Grade |
| Immigrants | Senegal | 1.0 /100 | #246 | Tragic 97.4% |
| Assyrians/Chaldeans/Syriacs | 1.0 /100 | #247 | Tragic 97.4% |
| Immigrants | Eastern Africa | 0.9 /100 | #248 | Tragic 97.4% |
| South Americans | 0.9 /100 | #249 | Tragic 97.4% |
| Immigrants | Middle Africa | 0.9 /100 | #250 | Tragic 97.4% |
| Immigrants | Asia | 0.8 /100 | #251 | Tragic 97.4% |
| Peruvians | 0.8 /100 | #252 | Tragic 97.4% |
| Immigrants | Africa | 0.8 /100 | #253 | Tragic 97.4% |
| Jamaicans | 0.7 /100 | #254 | Tragic 97.4% |
| Bolivians | 0.6 /100 | #255 | Tragic 97.3% |
| Immigrants | Congo | 0.6 /100 | #256 | Tragic 97.3% |
| Immigrants | Colombia | 0.5 /100 | #257 | Tragic 97.3% |
| Immigrants | Liberia | 0.5 /100 | #258 | Tragic 97.3% |
| Armenians | 0.4 /100 | #259 | Tragic 97.3% |
| Immigrants | Ethiopia | 0.4 /100 | #260 | Tragic 97.3% |
| Immigrants | South America | 0.4 /100 | #261 | Tragic 97.3% |
| Immigrants | Sierra Leone | 0.4 /100 | #262 | Tragic 97.3% |
| Taiwanese | 0.3 /100 | #263 | Tragic 97.3% |
| West Indians | 0.3 /100 | #264 | Tragic 97.3% |
| Immigrants | Jamaica | 0.3 /100 | #265 | Tragic 97.3% |
| Yaqui | 0.3 /100 | #266 | Tragic 97.3% |