Yaqui vs Menominee Master's Degree
COMPARE
Yaqui
Menominee
Master's Degree
Master's Degree Comparison
Yaqui
Menominee
11.0%
MASTER'S DEGREE
0.0/ 100
METRIC RATING
313th/ 347
METRIC RANK
10.2%
MASTER'S DEGREE
0.0/ 100
METRIC RATING
333rd/ 347
METRIC RANK
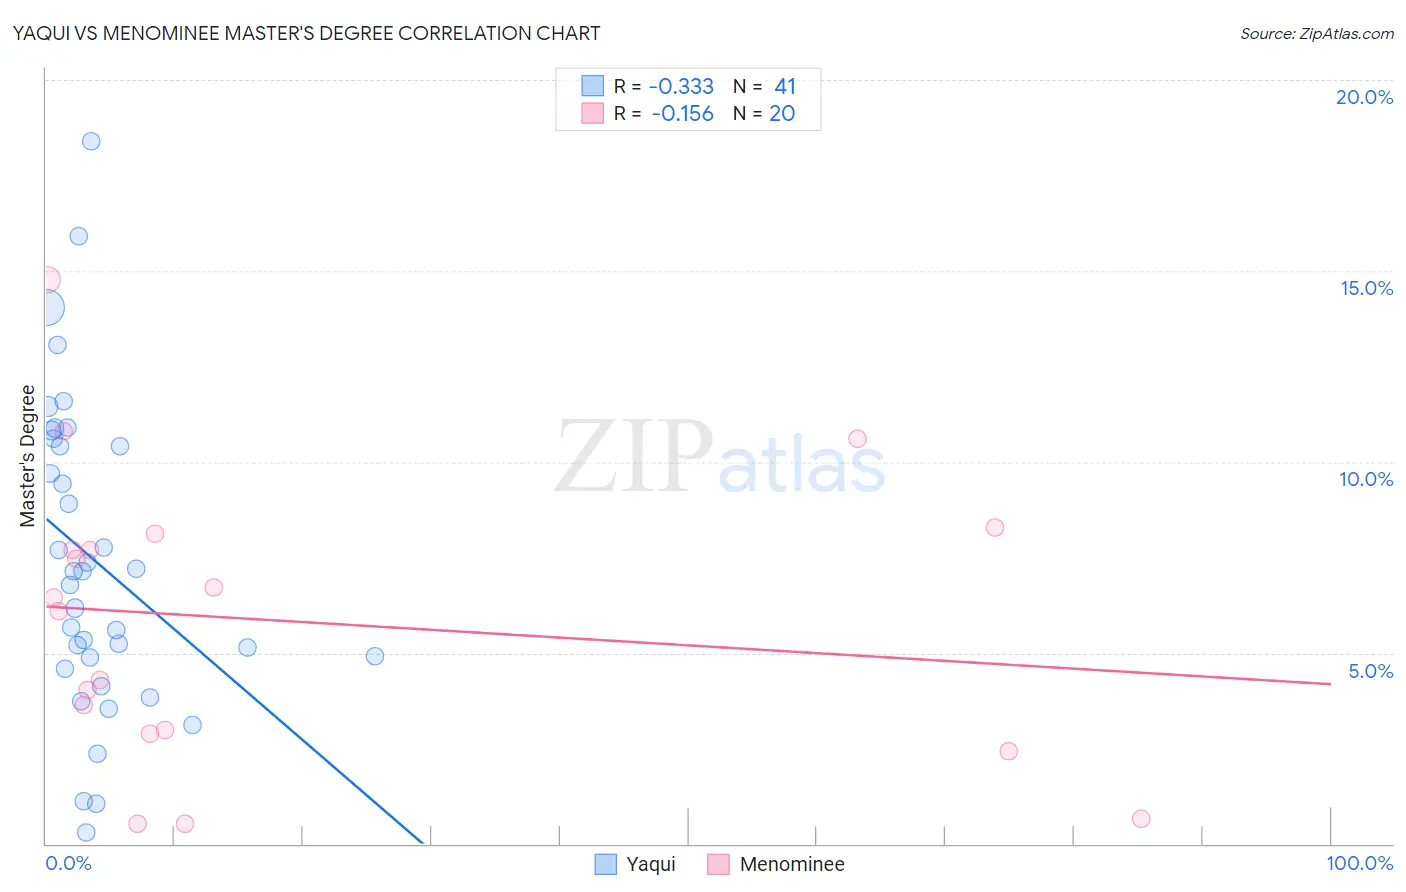
Yaqui vs Menominee Master's Degree Correlation Chart
The statistical analysis conducted on geographies consisting of 107,722,920 people shows a mild negative correlation between the proportion of Yaqui and percentage of population with at least master's degree education in the United States with a correlation coefficient (R) of -0.333 and weighted average of 11.0%. Similarly, the statistical analysis conducted on geographies consisting of 45,774,171 people shows a poor negative correlation between the proportion of Menominee and percentage of population with at least master's degree education in the United States with a correlation coefficient (R) of -0.156 and weighted average of 10.2%, a difference of 8.0%.
Master's Degree Correlation Summary
| Measurement | Yaqui | Menominee |
| Minimum | 0.29% | 0.53% |
| Maximum | 18.4% | 14.8% |
| Range | 18.1% | 14.2% |
| Mean | 7.4% | 5.8% |
| Median | 7.1% | 6.3% |
| Interquartile 25% (IQ1) | 4.7% | 2.9% |
| Interquartile 75% (IQ3) | 10.5% | 7.9% |
| Interquartile Range (IQR) | 5.8% | 5.0% |
| Standard Deviation (Sample) | 4.0% | 3.8% |
| Standard Deviation (Population) | 4.0% | 3.7% |
Demographics Similar to Yaqui and Menominee by Master's Degree
In terms of master's degree, the demographic groups most similar to Yaqui are Cajun (11.0%, a difference of 0.40%), Apache (11.0%, a difference of 0.40%), Hispanic or Latino (10.9%, a difference of 0.74%), Hopi (10.9%, a difference of 1.3%), and Immigrants from Cuba (10.9%, a difference of 1.4%). Similarly, the demographic groups most similar to Menominee are Immigrants from the Azores (10.2%, a difference of 0.37%), Pueblo (10.3%, a difference of 0.83%), Fijian (10.3%, a difference of 1.0%), Nepalese (10.5%, a difference of 2.7%), and Bangladeshi (10.5%, a difference of 2.8%).
| Demographics | Rating | Rank | Master's Degree |
| Yaqui | 0.0 /100 | #313 | Tragic 11.0% |
| Cajuns | 0.0 /100 | #314 | Tragic 11.0% |
| Apache | 0.0 /100 | #315 | Tragic 11.0% |
| Hispanics or Latinos | 0.0 /100 | #316 | Tragic 10.9% |
| Hopi | 0.0 /100 | #317 | Tragic 10.9% |
| Immigrants | Cuba | 0.0 /100 | #318 | Tragic 10.9% |
| Kiowa | 0.0 /100 | #319 | Tragic 10.8% |
| Immigrants | Micronesia | 0.0 /100 | #320 | Tragic 10.8% |
| Pennsylvania Germans | 0.0 /100 | #321 | Tragic 10.7% |
| Sioux | 0.0 /100 | #322 | Tragic 10.7% |
| Crow | 0.0 /100 | #323 | Tragic 10.6% |
| Dutch West Indians | 0.0 /100 | #324 | Tragic 10.6% |
| Inupiat | 0.0 /100 | #325 | Tragic 10.5% |
| Creek | 0.0 /100 | #326 | Tragic 10.5% |
| Paiute | 0.0 /100 | #327 | Tragic 10.5% |
| Bangladeshis | 0.0 /100 | #328 | Tragic 10.5% |
| Nepalese | 0.0 /100 | #329 | Tragic 10.5% |
| Fijians | 0.0 /100 | #330 | Tragic 10.3% |
| Pueblo | 0.0 /100 | #331 | Tragic 10.3% |
| Immigrants | Azores | 0.0 /100 | #332 | Tragic 10.2% |
| Menominee | 0.0 /100 | #333 | Tragic 10.2% |