Yaqui vs Immigrants from Central America Master's Degree
COMPARE
Yaqui
Immigrants from Central America
Master's Degree
Master's Degree Comparison
Yaqui
Immigrants from Central America
11.0%
MASTER'S DEGREE
0.0/ 100
METRIC RATING
313th/ 347
METRIC RANK
10.0%
MASTER'S DEGREE
0.0/ 100
METRIC RATING
335th/ 347
METRIC RANK
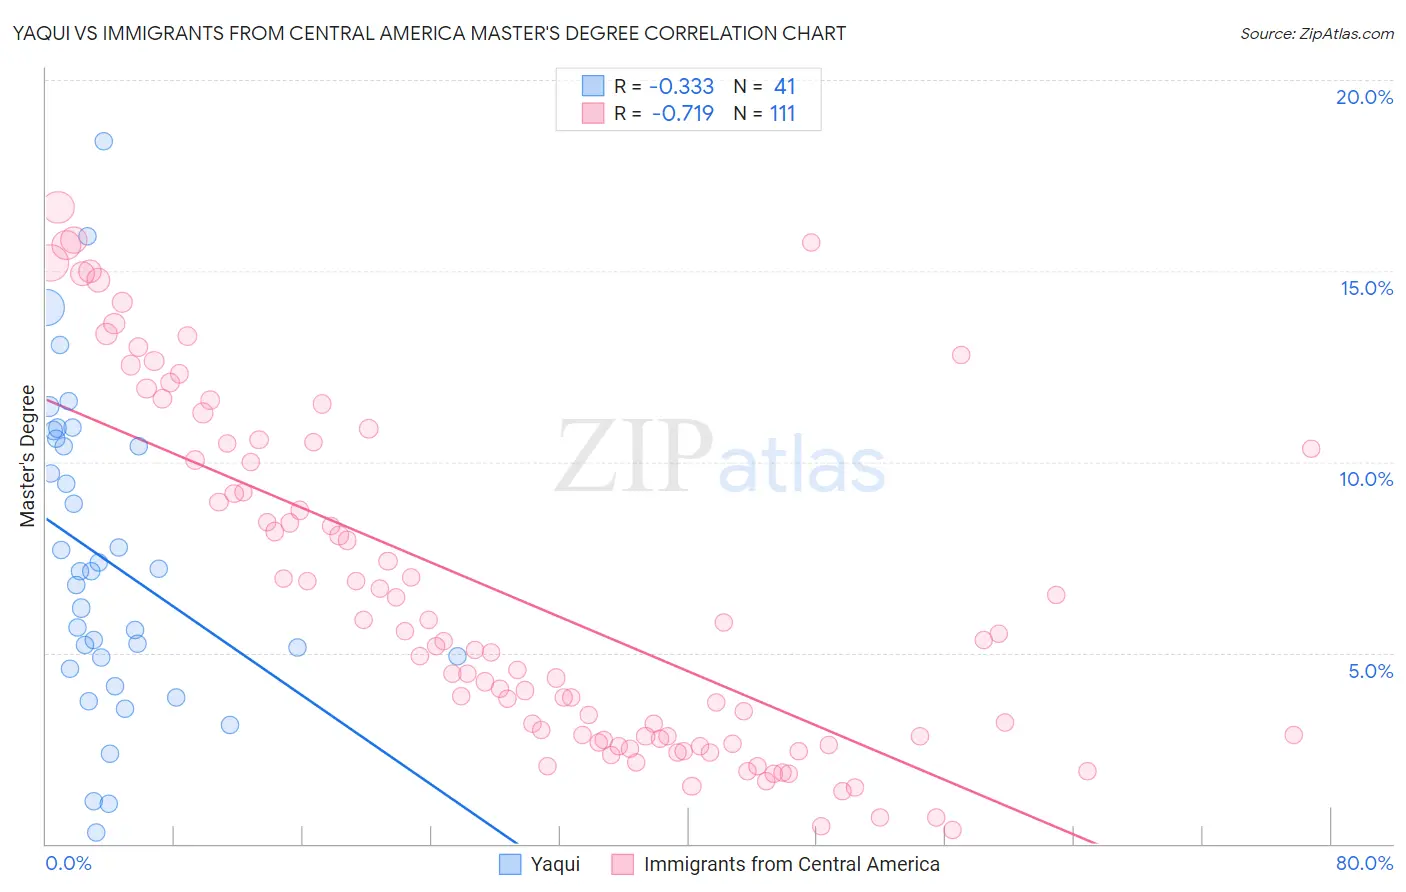
Yaqui vs Immigrants from Central America Master's Degree Correlation Chart
The statistical analysis conducted on geographies consisting of 107,722,920 people shows a mild negative correlation between the proportion of Yaqui and percentage of population with at least master's degree education in the United States with a correlation coefficient (R) of -0.333 and weighted average of 11.0%. Similarly, the statistical analysis conducted on geographies consisting of 535,778,431 people shows a strong negative correlation between the proportion of Immigrants from Central America and percentage of population with at least master's degree education in the United States with a correlation coefficient (R) of -0.719 and weighted average of 10.0%, a difference of 10.3%.
Master's Degree Correlation Summary
| Measurement | Yaqui | Immigrants from Central America |
| Minimum | 0.29% | 0.37% |
| Maximum | 18.4% | 16.7% |
| Range | 18.1% | 16.3% |
| Mean | 7.4% | 6.5% |
| Median | 7.1% | 5.2% |
| Interquartile 25% (IQ1) | 4.7% | 2.7% |
| Interquartile 75% (IQ3) | 10.5% | 10.3% |
| Interquartile Range (IQR) | 5.8% | 7.6% |
| Standard Deviation (Sample) | 4.0% | 4.5% |
| Standard Deviation (Population) | 4.0% | 4.4% |
Similar Demographics by Master's Degree
Demographics Similar to Yaqui by Master's Degree
In terms of master's degree, the demographic groups most similar to Yaqui are Choctaw (11.0%, a difference of 0.18%), Seminole (11.0%, a difference of 0.27%), Cajun (11.0%, a difference of 0.40%), Apache (11.0%, a difference of 0.40%), and Hispanic or Latino (10.9%, a difference of 0.74%).
| Demographics | Rating | Rank | Master's Degree |
| Mexican American Indians | 0.0 /100 | #306 | Tragic 11.2% |
| Cheyenne | 0.0 /100 | #307 | Tragic 11.2% |
| Puerto Ricans | 0.0 /100 | #308 | Tragic 11.2% |
| Puget Sound Salish | 0.0 /100 | #309 | Tragic 11.1% |
| Shoshone | 0.0 /100 | #310 | Tragic 11.1% |
| Seminole | 0.0 /100 | #311 | Tragic 11.0% |
| Choctaw | 0.0 /100 | #312 | Tragic 11.0% |
| Yaqui | 0.0 /100 | #313 | Tragic 11.0% |
| Cajuns | 0.0 /100 | #314 | Tragic 11.0% |
| Apache | 0.0 /100 | #315 | Tragic 11.0% |
| Hispanics or Latinos | 0.0 /100 | #316 | Tragic 10.9% |
| Hopi | 0.0 /100 | #317 | Tragic 10.9% |
| Immigrants | Cuba | 0.0 /100 | #318 | Tragic 10.9% |
| Kiowa | 0.0 /100 | #319 | Tragic 10.8% |
| Immigrants | Micronesia | 0.0 /100 | #320 | Tragic 10.8% |
Demographics Similar to Immigrants from Central America by Master's Degree
In terms of master's degree, the demographic groups most similar to Immigrants from Central America are Arapaho (10.0%, a difference of 0.13%), Native/Alaskan (9.9%, a difference of 0.50%), Menominee (10.2%, a difference of 2.1%), Immigrants from the Azores (10.2%, a difference of 2.5%), and Mexican (9.7%, a difference of 2.8%).
| Demographics | Rating | Rank | Master's Degree |
| Bangladeshis | 0.0 /100 | #328 | Tragic 10.5% |
| Nepalese | 0.0 /100 | #329 | Tragic 10.5% |
| Fijians | 0.0 /100 | #330 | Tragic 10.3% |
| Pueblo | 0.0 /100 | #331 | Tragic 10.3% |
| Immigrants | Azores | 0.0 /100 | #332 | Tragic 10.2% |
| Menominee | 0.0 /100 | #333 | Tragic 10.2% |
| Arapaho | 0.0 /100 | #334 | Tragic 10.0% |
| Immigrants | Central America | 0.0 /100 | #335 | Tragic 10.0% |
| Natives/Alaskans | 0.0 /100 | #336 | Tragic 9.9% |
| Mexicans | 0.0 /100 | #337 | Tragic 9.7% |
| Tohono O'odham | 0.0 /100 | #338 | Tragic 9.7% |
| Spanish American Indians | 0.0 /100 | #339 | Tragic 9.6% |
| Yakama | 0.0 /100 | #340 | Tragic 9.5% |
| Navajo | 0.0 /100 | #341 | Tragic 9.4% |
| Immigrants | Mexico | 0.0 /100 | #342 | Tragic 9.3% |