Yaqui vs Immigrants from India Master's Degree

COMPARE

Yaqui
Race
Ancestry
AfghanAfricanAlaska NativeAlaskan AthabascanAlbanianAleutAlsatianAmericanApacheArabArapahoArgentineanArmenianAssyrian/Chaldean/SyriacAustralianAustrianBahamianBangladeshiBarbadianBasqueBelgianBelizeanBermudanBhutaneseBlackfeetBolivianBrazilianBritishBritish West IndianBulgarianBurmeseCajunCambodianCanadianCape VerdeanCarpatho RusynCelticCentral AmericanCentral American IndianCherokeeCheyenneChickasawChileanChineseChippewaChoctawColombianColvilleComancheCosta RicanCreeCreekCroatianCrowCubanCypriotCzechCzechoslovakianDanishDelawareDominicanDutchDutch West IndianEastern EuropeanEcuadorianEgyptianEnglishEstonianEthiopianEuropeanFijianFilipinoFinnishFrenchFrench American IndianFrench CanadianGermanGerman RussianGhanaianGreekGuamanian/ChamorroGuatemalanGuyaneseHaitianHmongHonduranHopiHoumaHungarianIcelanderIndian (Asian)IndonesianInupiatIranianIraqiIrishIroquoisIsraeliItalianJamaicanJapaneseJordanianKenyanKiowaKoreanLaotianLatvianLebaneseLiberianLithuanianLumbeeLuxembourgerMacedonianMalaysianMalteseMarshalleseMenomineeMexicanMexican American IndianMongolianMoroccanNative HawaiianNavajoNepaleseNew ZealanderNicaraguanNigerianNorthern EuropeanNorwegianOkinawanOsageOttawaPaiutePakistaniPalestinianPanamanianParaguayanPennsylvania GermanPeruvianPimaPolishPortuguesePotawatomiPuebloPuerto RicanPuget Sound SalishRomanianRussianSalvadoranSamoanScandinavianScotch-IrishScottishSeminoleSenegaleseSerbianShoshoneSierra LeoneanSiouxSlavicSlovakSloveneSomaliSouth AfricanSouth AmericanSouth American IndianSoviet UnionSpaniardSpanishSpanish AmericanSpanish American IndianSri LankanSubsaharan AfricanSudaneseSwedishSwissSyrianTaiwaneseThaiTlingit-HaidaTohono O'OdhamTonganTrinidadian and TobagonianTsimshianTurkishU.S. Virgin IslanderUgandanUkrainianUruguayanUteVenezuelanVietnameseWelshWest IndianYakamaYaquiYugoslavianYumanYup'ikZimbabwean
Immigration
NonimmigrantsImmigrantsAfghanistanAfricaAlbaniaArgentinaArmeniaAsiaAustraliaAustriaBahamasBangladeshBarbadosBelarusBelgiumBelizeBoliviaBosnia and HerzegovinaBrazilBulgariaBurma/MyanmarCabo VerdeCambodiaCameroonCanadaCaribbeanCentral AmericaChileChinaColombiaCongoCosta RicaCroatiaCubaCzechoslovakiaDenmarkDominicaDominican RepublicEastern AfricaEastern AsiaEastern EuropeEcuadorEgyptEl SalvadorEnglandEritreaEthiopiaEuropeFijiFranceGermanyGhanaGreeceGrenadaGuatemalaGuyanaHaitiHondurasHong KongHungaryIndonesiaIranIraqIrelandIsraelItalyJamaicaJapanJordanKazakhstanKenyaKoreaKuwaitLaosLatin AmericaLatviaLebanonLiberiaLithuaniaMalaysiaMexicoMicronesiaMiddle AfricaMoldovaMoroccoNepalNetherlandsNicaraguaNigeriaNorth AmericaNorth MacedoniaNorthern AfricaNorthern EuropeNorwayOceaniaPakistanPanamaPeruPhilippinesPolandPortugalRomaniaRussiaSaudi ArabiaScotlandSenegalSerbiaSierra LeoneSingaporeSomaliaSouth AfricaSouth AmericaSouth Central AsiaSouth Eastern AsiaSouthern EuropeSpainSri LankaSt. Vincent and the GrenadinesSudanSwedenSwitzerlandSyriaTaiwanThailandTrinidad and TobagoTurkeyUgandaUkraineUruguayUzbekistanVenezuelaVietnamWest IndiesWestern AfricaWestern AsiaWestern EuropeYemenZaireZimbabweAzores
Immigrants from India
Race
Ancestry
AfghanAfricanAlaska NativeAlaskan AthabascanAlbanianAleutAlsatianAmericanApacheArabArapahoArgentineanArmenianAssyrian/Chaldean/SyriacAustralianAustrianBahamianBangladeshiBarbadianBasqueBelgianBelizeanBermudanBhutaneseBlackfeetBolivianBrazilianBritishBritish West IndianBulgarianBurmeseCajunCambodianCanadianCape VerdeanCarpatho RusynCelticCentral AmericanCentral American IndianCherokeeCheyenneChickasawChileanChineseChippewaChoctawColombianColvilleComancheCosta RicanCreeCreekCroatianCrowCubanCypriotCzechCzechoslovakianDanishDelawareDominicanDutchDutch West IndianEastern EuropeanEcuadorianEgyptianEnglishEstonianEthiopianEuropeanFijianFilipinoFinnishFrenchFrench American IndianFrench CanadianGermanGerman RussianGhanaianGreekGuamanian/ChamorroGuatemalanGuyaneseHaitianHmongHonduranHopiHoumaHungarianIcelanderIndian (Asian)IndonesianInupiatIranianIraqiIrishIroquoisIsraeliItalianJamaicanJapaneseJordanianKenyanKiowaKoreanLaotianLatvianLebaneseLiberianLithuanianLumbeeLuxembourgerMacedonianMalaysianMalteseMarshalleseMenomineeMexicanMexican American IndianMongolianMoroccanNative HawaiianNavajoNepaleseNew ZealanderNicaraguanNigerianNorthern EuropeanNorwegianOkinawanOsageOttawaPaiutePakistaniPalestinianPanamanianParaguayanPennsylvania GermanPeruvianPimaPolishPortuguesePotawatomiPuebloPuerto RicanPuget Sound SalishRomanianRussianSalvadoranSamoanScandinavianScotch-IrishScottishSeminoleSenegaleseSerbianShoshoneSierra LeoneanSiouxSlavicSlovakSloveneSomaliSouth AfricanSouth AmericanSouth American IndianSoviet UnionSpaniardSpanishSpanish AmericanSpanish American IndianSri LankanSubsaharan AfricanSudaneseSwedishSwissSyrianTaiwaneseThaiTlingit-HaidaTohono O'OdhamTonganTrinidadian and TobagonianTsimshianTurkishU.S. Virgin IslanderUgandanUkrainianUruguayanUteVenezuelanVietnameseWelshWest IndianYakamaYugoslavianYumanYup'ikZimbabwean
Immigration
NonimmigrantsImmigrantsAfghanistanAfricaAlbaniaArgentinaArmeniaAsiaAustraliaAustriaBahamasBangladeshBarbadosBelarusBelgiumBelizeBoliviaBosnia and HerzegovinaBrazilBulgariaBurma/MyanmarCabo VerdeCambodiaCameroonCanadaCaribbeanCentral AmericaChileChinaColombiaCongoCosta RicaCroatiaCubaCzechoslovakiaDenmarkDominicaDominican RepublicEastern AfricaEastern AsiaEastern EuropeEcuadorEgyptEl SalvadorEnglandEritreaEthiopiaEuropeFijiFranceGermanyGhanaGreeceGrenadaGuatemalaGuyanaHaitiHondurasHong KongHungaryIndiaIndonesiaIranIraqIrelandIsraelItalyJamaicaJapanJordanKazakhstanKenyaKoreaKuwaitLaosLatin AmericaLatviaLebanonLiberiaLithuaniaMalaysiaMexicoMicronesiaMiddle AfricaMoldovaMoroccoNepalNetherlandsNicaraguaNigeriaNorth AmericaNorth MacedoniaNorthern AfricaNorthern EuropeNorwayOceaniaPakistanPanamaPeruPhilippinesPolandPortugalRomaniaRussiaSaudi ArabiaScotlandSenegalSerbiaSierra LeoneSingaporeSomaliaSouth AfricaSouth AmericaSouth Central AsiaSouth Eastern AsiaSouthern EuropeSpainSri LankaSt. Vincent and the GrenadinesSudanSwedenSwitzerlandSyriaTaiwanThailandTrinidad and TobagoTurkeyUgandaUkraineUruguayUzbekistanVenezuelaVietnamWest IndiesWestern AfricaWestern AsiaWestern EuropeYemenZaireZimbabweAzores
Master's Degree
Income
Poverty
Unemployment
Labor Participation
Family Structure
Vehicle Availability
Education Level
Disability

Master's Degree Comparison

Yaqui

Immigrants from India

Tragic
Exceptional
11.0%
MASTER'S DEGREE
0.0/ 100
METRIC RATING
313th/ 347
METRIC RANK
22.3%
MASTER'S DEGREE
100.0/ 100
METRIC RATING
6th/ 347
METRIC RANK

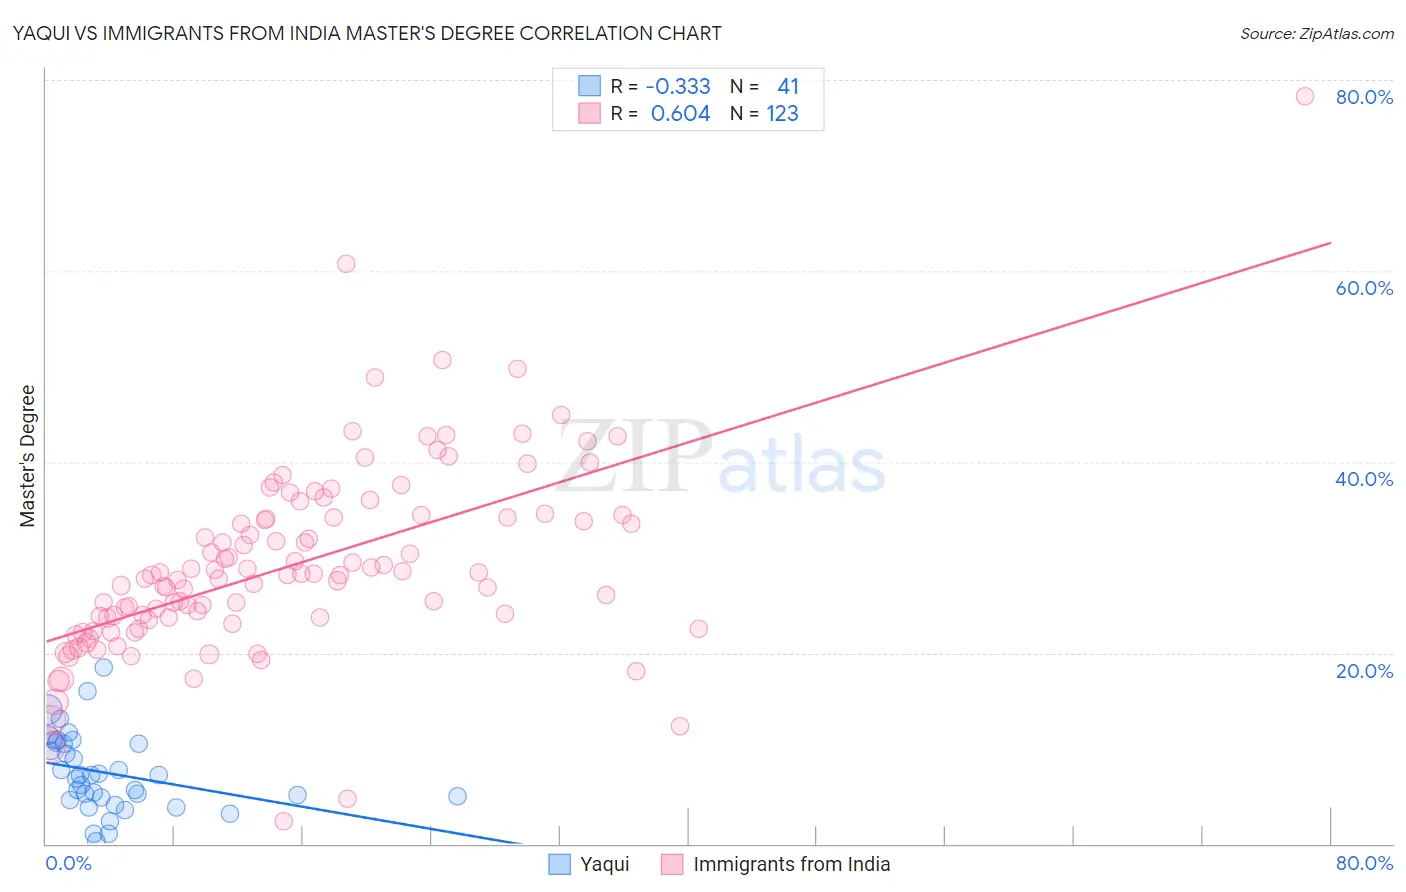
Yaqui vs Immigrants from India Master's Degree Correlation Chart

The statistical analysis conducted on geographies consisting of 107,722,920 people shows a mild negative correlation between the proportion of Yaqui and percentage of population with at least master's degree education in the United States with a correlation coefficient (R) of -0.333 and weighted average of 11.0%. Similarly, the statistical analysis conducted on geographies consisting of 433,961,661 people shows a significant positive correlation between the proportion of Immigrants from India and percentage of population with at least master's degree education in the United States with a correlation coefficient (R) of 0.604 and weighted average of 22.3%, a difference of 102.6%.
Yaqui vs Immigrants from India Master's Degree

Master's Degree Correlation Summary

MeasurementYaquiImmigrants from India
Minimum0.29%2.4%
Maximum18.4%78.4%
Range18.1%76.0%
Mean7.4%29.2%
Median7.1%28.2%
Interquartile 25% (IQ1)4.7%23.4%
Interquartile 75% (IQ3)10.5%34.2%
Interquartile Range (IQR)5.8%10.8%
Standard Deviation (Sample)4.0%10.1%
Standard Deviation (Population)4.0%10.0%

Similar Demographics by Master's Degree

Demographics Similar to Yaqui by Master's Degree

In terms of master's degree, the demographic groups most similar to Yaqui are Choctaw (11.0%, a difference of 0.18%), Seminole (11.0%, a difference of 0.27%), Cajun (11.0%, a difference of 0.40%), Apache (11.0%, a difference of 0.40%), and Hispanic or Latino (10.9%, a difference of 0.74%).
DemographicsRating | RankMaster's Degree
Mexican American Indians
0.0
/100
|
#306
Tragic
11.2%
Cheyenne
0.0
/100
|
#307
Tragic
11.2%
Puerto Ricans
0.0
/100
|
#308
Tragic
11.2%
Puget Sound Salish
0.0
/100
|
#309
Tragic
11.1%
Shoshone
0.0
/100
|
#310
Tragic
11.1%
Seminole
0.0
/100
|
#311
Tragic
11.0%
Choctaw
0.0
/100
|
#312
Tragic
11.0%
Yaqui
0.0
/100
|
#313
Tragic
11.0%
Cajuns
0.0
/100
|
#314
Tragic
11.0%
Apache
0.0
/100
|
#315
Tragic
11.0%
Hispanics or Latinos
0.0
/100
|
#316
Tragic
10.9%
Hopi
0.0
/100
|
#317
Tragic
10.9%
Immigrants | Cuba
0.0
/100
|
#318
Tragic
10.9%
Kiowa
0.0
/100
|
#319
Tragic
10.8%
Immigrants | Micronesia
0.0
/100
|
#320
Tragic
10.8%

Demographics Similar to Immigrants from India by Master's Degree

In terms of master's degree, the demographic groups most similar to Immigrants from India are Iranian (22.3%, a difference of 0.21%), Immigrants from Taiwan (22.5%, a difference of 0.68%), Immigrants from Israel (22.6%, a difference of 1.5%), Okinawan (22.6%, a difference of 1.5%), and Cypriot (21.8%, a difference of 2.4%).
DemographicsRating | RankMaster's Degree
Immigrants | Singapore
100.0
/100
|
#1
Exceptional
23.4%
Filipinos
100.0
/100
|
#2
Exceptional
23.4%
Immigrants | Israel
100.0
/100
|
#3
Exceptional
22.6%
Okinawans
100.0
/100
|
#4
Exceptional
22.6%
Immigrants | Taiwan
100.0
/100
|
#5
Exceptional
22.5%
Immigrants | India
100.0
/100
|
#6
Exceptional
22.3%
Iranians
100.0
/100
|
#7
Exceptional
22.3%
Cypriots
100.0
/100
|
#8
Exceptional
21.8%
Thais
100.0
/100
|
#9
Exceptional
21.7%
Immigrants | Iran
100.0
/100
|
#10
Exceptional
21.6%
Immigrants | China
100.0
/100
|
#11
Exceptional
21.2%
Eastern Europeans
100.0
/100
|
#12
Exceptional
21.1%
Immigrants | Australia
100.0
/100
|
#13
Exceptional
20.9%
Immigrants | Switzerland
100.0
/100
|
#14
Exceptional
20.9%
Immigrants | Eastern Asia
100.0
/100
|
#15
Exceptional
20.8%