Jordanian vs Immigrants from Poland Professional Degree
COMPARE
Jordanian
Immigrants from Poland
Professional Degree
Professional Degree Comparison
Jordanians
Immigrants from Poland
4.7%
PROFESSIONAL DEGREE
88.9/ 100
METRIC RATING
137th/ 347
METRIC RANK
4.3%
PROFESSIONAL DEGREE
29.2/ 100
METRIC RATING
190th/ 347
METRIC RANK
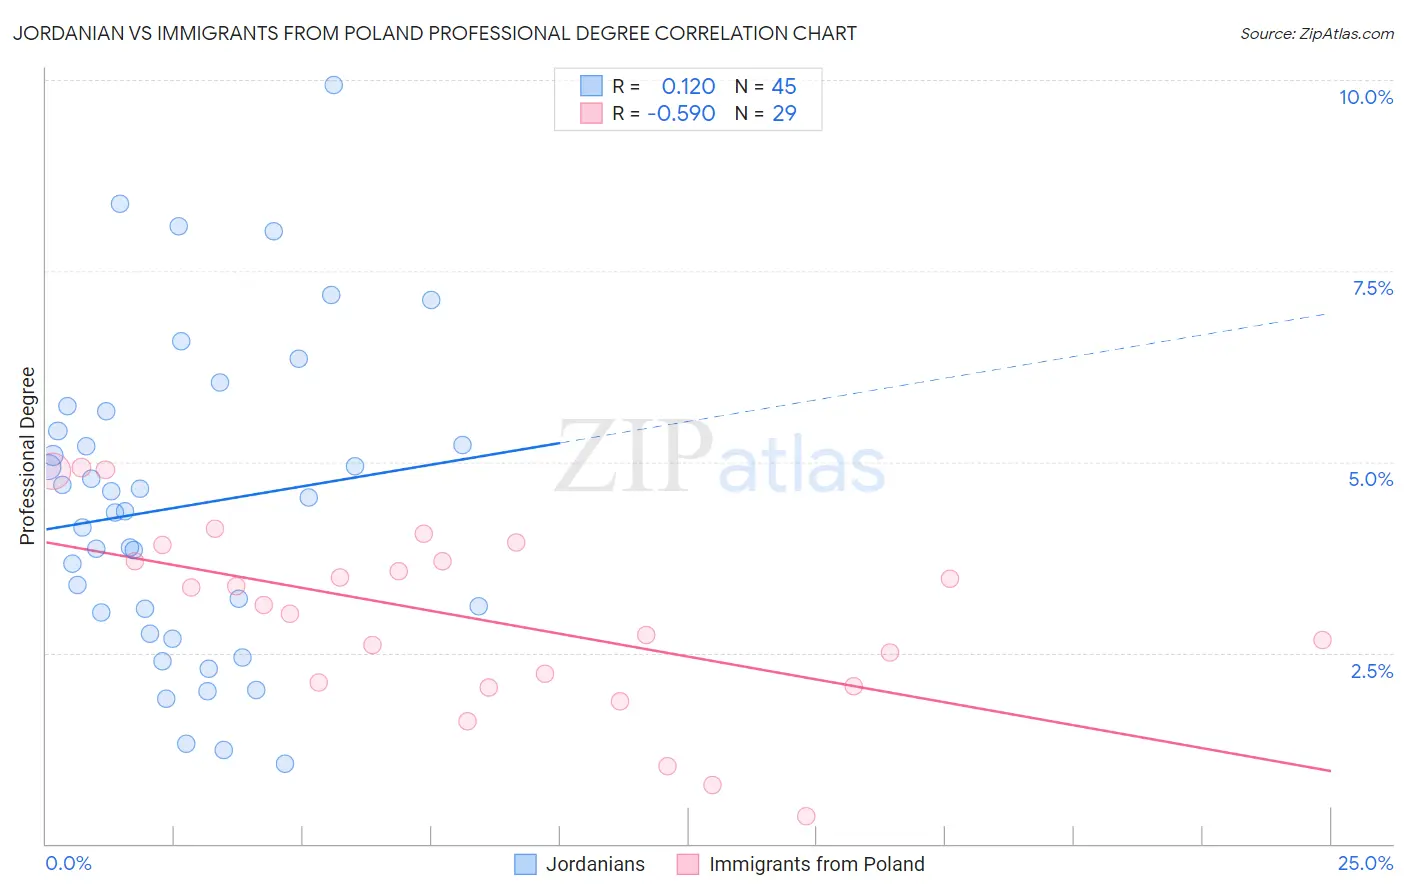
Jordanian vs Immigrants from Poland Professional Degree Correlation Chart
The statistical analysis conducted on geographies consisting of 166,340,382 people shows a poor positive correlation between the proportion of Jordanians and percentage of population with at least professional degree education in the United States with a correlation coefficient (R) of 0.120 and weighted average of 4.7%. Similarly, the statistical analysis conducted on geographies consisting of 304,504,967 people shows a substantial negative correlation between the proportion of Immigrants from Poland and percentage of population with at least professional degree education in the United States with a correlation coefficient (R) of -0.590 and weighted average of 4.3%, a difference of 11.2%.
Professional Degree Correlation Summary
| Measurement | Jordanian | Immigrants from Poland |
| Minimum | 1.0% | 0.35% |
| Maximum | 9.9% | 4.9% |
| Range | 8.9% | 4.6% |
| Mean | 4.4% | 3.0% |
| Median | 4.4% | 3.1% |
| Interquartile 25% (IQ1) | 2.9% | 2.1% |
| Interquartile 75% (IQ3) | 5.5% | 3.8% |
| Interquartile Range (IQR) | 2.7% | 1.7% |
| Standard Deviation (Sample) | 2.0% | 1.2% |
| Standard Deviation (Population) | 2.0% | 1.2% |
Similar Demographics by Professional Degree
Demographics Similar to Jordanians by Professional Degree
In terms of professional degree, the demographic groups most similar to Jordanians are Immigrants from Jordan (4.7%, a difference of 0.020%), Afghan (4.7%, a difference of 0.040%), Macedonian (4.8%, a difference of 0.30%), South American Indian (4.8%, a difference of 0.34%), and Italian (4.8%, a difference of 0.46%).
| Demographics | Rating | Rank | Professional Degree |
| Icelanders | 91.5 /100 | #130 | Exceptional 4.8% |
| Immigrants | Nepal | 91.4 /100 | #131 | Exceptional 4.8% |
| Pakistanis | 90.9 /100 | #132 | Exceptional 4.8% |
| Italians | 90.2 /100 | #133 | Exceptional 4.8% |
| South American Indians | 89.9 /100 | #134 | Excellent 4.8% |
| Macedonians | 89.8 /100 | #135 | Excellent 4.8% |
| Immigrants | Jordan | 89.0 /100 | #136 | Excellent 4.7% |
| Jordanians | 88.9 /100 | #137 | Excellent 4.7% |
| Afghans | 88.8 /100 | #138 | Excellent 4.7% |
| South Americans | 85.6 /100 | #139 | Excellent 4.7% |
| Canadians | 84.4 /100 | #140 | Excellent 4.7% |
| Basques | 81.8 /100 | #141 | Excellent 4.6% |
| Sudanese | 81.3 /100 | #142 | Excellent 4.6% |
| Hungarians | 80.8 /100 | #143 | Excellent 4.6% |
| Immigrants | South America | 80.5 /100 | #144 | Excellent 4.6% |
Demographics Similar to Immigrants from Poland by Professional Degree
In terms of professional degree, the demographic groups most similar to Immigrants from Poland are Sri Lankan (4.3%, a difference of 0.040%), Slovak (4.3%, a difference of 0.26%), Ghanaian (4.3%, a difference of 0.36%), French (4.2%, a difference of 0.40%), and Immigrants from Thailand (4.3%, a difference of 0.44%).
| Demographics | Rating | Rank | Professional Degree |
| Bermudans | 43.1 /100 | #183 | Average 4.4% |
| Belgians | 36.2 /100 | #184 | Fair 4.3% |
| Welsh | 35.8 /100 | #185 | Fair 4.3% |
| Scotch-Irish | 34.2 /100 | #186 | Fair 4.3% |
| Immigrants | Cameroon | 33.3 /100 | #187 | Fair 4.3% |
| Immigrants | Thailand | 31.7 /100 | #188 | Fair 4.3% |
| Slovaks | 30.7 /100 | #189 | Fair 4.3% |
| Immigrants | Poland | 29.2 /100 | #190 | Fair 4.3% |
| Sri Lankans | 29.0 /100 | #191 | Fair 4.3% |
| Ghanaians | 27.3 /100 | #192 | Fair 4.3% |
| French | 27.1 /100 | #193 | Fair 4.2% |
| Scandinavians | 25.8 /100 | #194 | Fair 4.2% |
| Nigerians | 24.6 /100 | #195 | Fair 4.2% |
| Spanish | 23.0 /100 | #196 | Fair 4.2% |
| Czechoslovakians | 22.4 /100 | #197 | Fair 4.2% |