White/Caucasian vs Navajo College, 1 year or more
COMPARE
White/Caucasian
Navajo
College, 1 year or more
College, 1 year or more Comparison
Whites/Caucasians
Navajo
57.6%
COLLEGE, 1 YEAR OR MORE
8.7/ 100
METRIC RATING
219th/ 347
METRIC RANK
50.8%
COLLEGE, 1 YEAR OR MORE
0.0/ 100
METRIC RATING
322nd/ 347
METRIC RANK
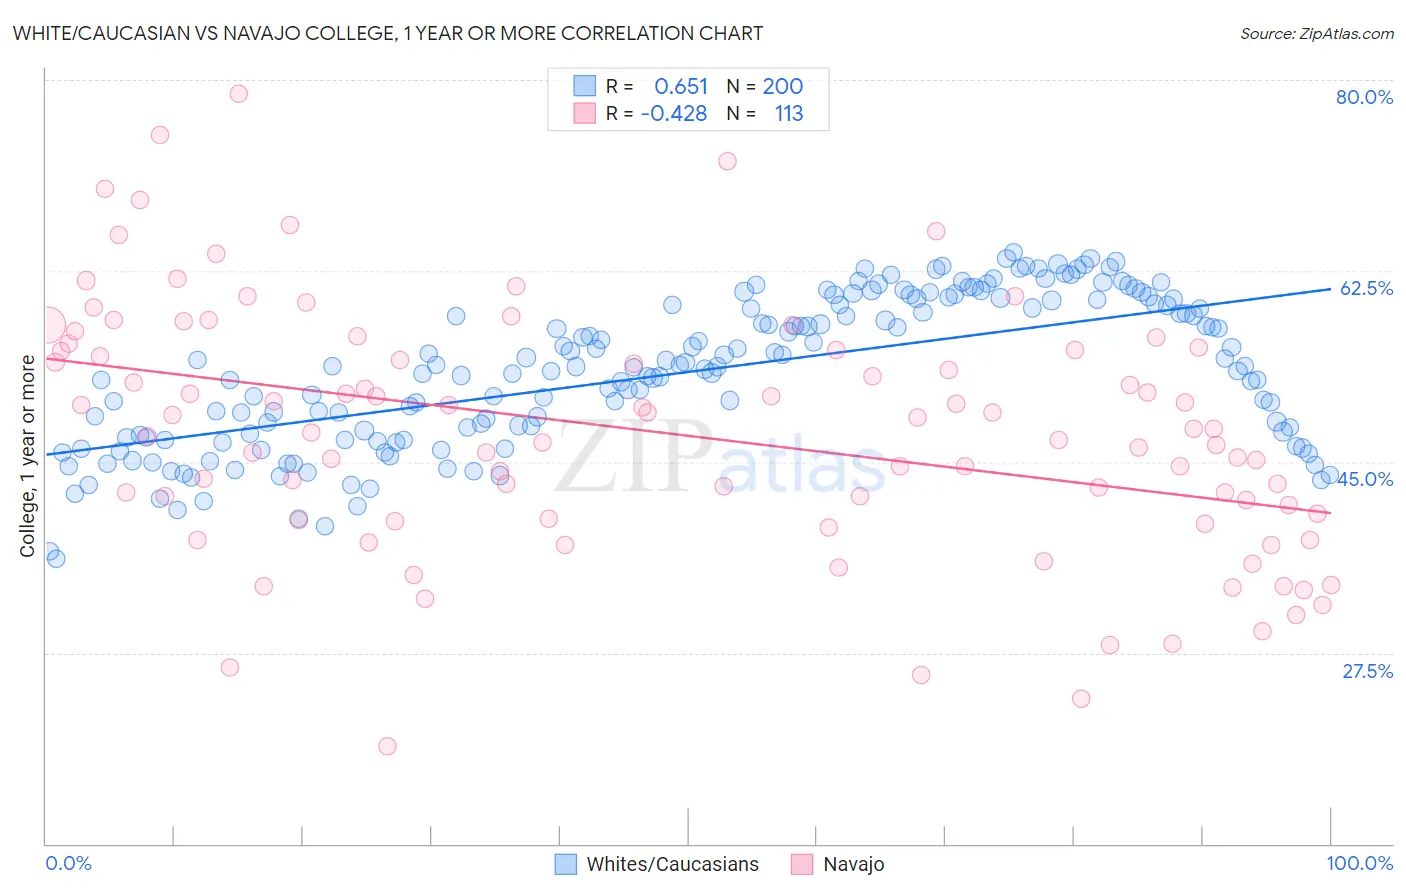
White/Caucasian vs Navajo College, 1 year or more Correlation Chart
The statistical analysis conducted on geographies consisting of 585,171,968 people shows a significant positive correlation between the proportion of Whites/Caucasians and percentage of population with at least college, 1 year or more education in the United States with a correlation coefficient (R) of 0.651 and weighted average of 57.6%. Similarly, the statistical analysis conducted on geographies consisting of 224,872,239 people shows a moderate negative correlation between the proportion of Navajo and percentage of population with at least college, 1 year or more education in the United States with a correlation coefficient (R) of -0.428 and weighted average of 50.8%, a difference of 13.3%.
College, 1 year or more Correlation Summary
| Measurement | White/Caucasian | Navajo |
| Minimum | 36.1% | 18.9% |
| Maximum | 64.2% | 78.7% |
| Range | 28.2% | 59.8% |
| Mean | 53.2% | 47.6% |
| Median | 53.7% | 47.7% |
| Interquartile 25% (IQ1) | 47.4% | 39.7% |
| Interquartile 75% (IQ3) | 59.5% | 55.3% |
| Interquartile Range (IQR) | 12.1% | 15.6% |
| Standard Deviation (Sample) | 6.7% | 11.4% |
| Standard Deviation (Population) | 6.7% | 11.3% |
Similar Demographics by College, 1 year or more
Demographics Similar to Whites/Caucasians by College, 1 year or more
In terms of college, 1 year or more, the demographic groups most similar to Whites/Caucasians are Native Hawaiian (57.6%, a difference of 0.060%), Immigrants from Panama (57.6%, a difference of 0.070%), Immigrants from Costa Rica (57.5%, a difference of 0.12%), Immigrants from Ghana (57.4%, a difference of 0.19%), and Immigrants from Peru (57.7%, a difference of 0.30%).
| Demographics | Rating | Rank | College, 1 year or more |
| Immigrants | Senegal | 11.8 /100 | #212 | Poor 57.8% |
| French Canadians | 11.8 /100 | #213 | Poor 57.8% |
| Immigrants | Colombia | 11.6 /100 | #214 | Poor 57.8% |
| Tongans | 11.6 /100 | #215 | Poor 57.8% |
| Immigrants | Peru | 10.6 /100 | #216 | Poor 57.7% |
| Immigrants | Panama | 9.1 /100 | #217 | Tragic 57.6% |
| Native Hawaiians | 9.0 /100 | #218 | Tragic 57.6% |
| Whites/Caucasians | 8.7 /100 | #219 | Tragic 57.6% |
| Immigrants | Costa Rica | 8.0 /100 | #220 | Tragic 57.5% |
| Immigrants | Ghana | 7.7 /100 | #221 | Tragic 57.4% |
| Sub-Saharan Africans | 6.1 /100 | #222 | Tragic 57.3% |
| Portuguese | 5.4 /100 | #223 | Tragic 57.2% |
| Hmong | 5.4 /100 | #224 | Tragic 57.2% |
| Vietnamese | 4.7 /100 | #225 | Tragic 57.0% |
| Immigrants | Western Africa | 4.6 /100 | #226 | Tragic 57.0% |
Demographics Similar to Navajo by College, 1 year or more
In terms of college, 1 year or more, the demographic groups most similar to Navajo are Hopi (50.9%, a difference of 0.18%), Immigrants from Guatemala (50.7%, a difference of 0.23%), Immigrants from Cuba (50.7%, a difference of 0.24%), Immigrants from Latin America (50.7%, a difference of 0.27%), and Kiowa (51.0%, a difference of 0.31%).
| Demographics | Rating | Rank | College, 1 year or more |
| Guatemalans | 0.0 /100 | #315 | Tragic 51.2% |
| Cajuns | 0.0 /100 | #316 | Tragic 51.2% |
| Hispanics or Latinos | 0.0 /100 | #317 | Tragic 51.1% |
| Immigrants | Honduras | 0.0 /100 | #318 | Tragic 51.0% |
| Immigrants | El Salvador | 0.0 /100 | #319 | Tragic 51.0% |
| Kiowa | 0.0 /100 | #320 | Tragic 51.0% |
| Hopi | 0.0 /100 | #321 | Tragic 50.9% |
| Navajo | 0.0 /100 | #322 | Tragic 50.8% |
| Immigrants | Guatemala | 0.0 /100 | #323 | Tragic 50.7% |
| Immigrants | Cuba | 0.0 /100 | #324 | Tragic 50.7% |
| Immigrants | Latin America | 0.0 /100 | #325 | Tragic 50.7% |
| Dominicans | 0.0 /100 | #326 | Tragic 50.6% |
| Menominee | 0.0 /100 | #327 | Tragic 50.6% |
| Dutch West Indians | 0.0 /100 | #328 | Tragic 50.5% |
| Cape Verdeans | 0.0 /100 | #329 | Tragic 50.3% |