Immigrants from Belgium vs Immigrants from Poland College, 1 year or more
COMPARE
Immigrants from Belgium
Immigrants from Poland
College, 1 year or more
College, 1 year or more Comparison
Immigrants from Belgium
Immigrants from Poland
66.3%
COLLEGE, 1 YEAR OR MORE
100.0/ 100
METRIC RATING
24th/ 347
METRIC RANK
59.4%
COLLEGE, 1 YEAR OR MORE
48.9/ 100
METRIC RATING
176th/ 347
METRIC RANK
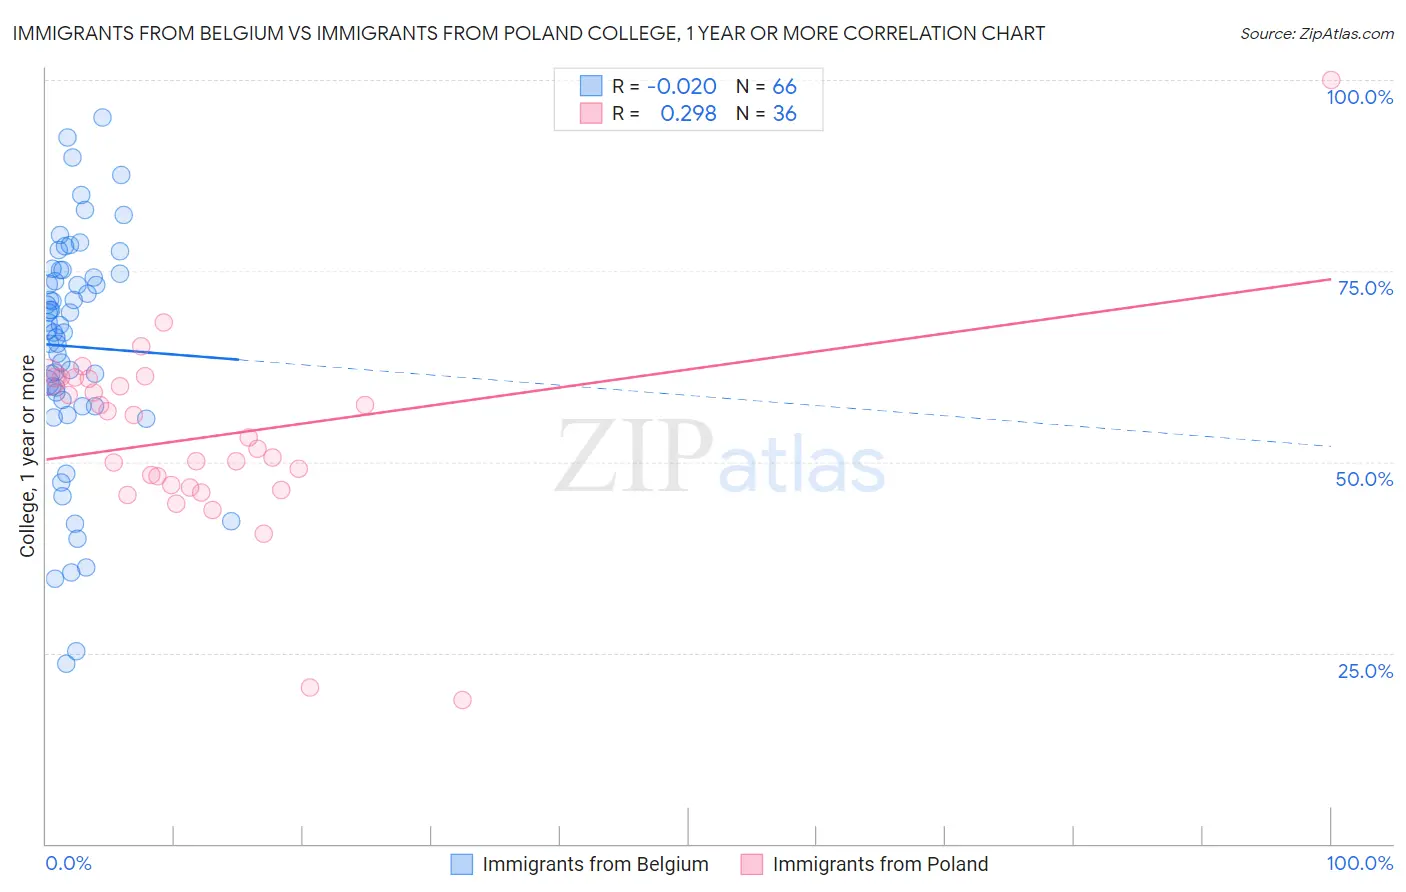
Immigrants from Belgium vs Immigrants from Poland College, 1 year or more Correlation Chart
The statistical analysis conducted on geographies consisting of 146,729,232 people shows no correlation between the proportion of Immigrants from Belgium and percentage of population with at least college, 1 year or more education in the United States with a correlation coefficient (R) of -0.020 and weighted average of 66.3%. Similarly, the statistical analysis conducted on geographies consisting of 304,861,916 people shows a weak positive correlation between the proportion of Immigrants from Poland and percentage of population with at least college, 1 year or more education in the United States with a correlation coefficient (R) of 0.298 and weighted average of 59.4%, a difference of 11.7%.
College, 1 year or more Correlation Summary
| Measurement | Immigrants from Belgium | Immigrants from Poland |
| Minimum | 23.6% | 18.8% |
| Maximum | 95.1% | 100.0% |
| Range | 71.6% | 81.2% |
| Mean | 65.1% | 53.3% |
| Median | 67.6% | 52.5% |
| Interquartile 25% (IQ1) | 58.2% | 46.8% |
| Interquartile 75% (IQ3) | 74.7% | 60.9% |
| Interquartile Range (IQR) | 16.5% | 14.1% |
| Standard Deviation (Sample) | 15.3% | 13.2% |
| Standard Deviation (Population) | 15.1% | 13.0% |
Similar Demographics by College, 1 year or more
Demographics Similar to Immigrants from Belgium by College, 1 year or more
In terms of college, 1 year or more, the demographic groups most similar to Immigrants from Belgium are Immigrants from China (66.4%, a difference of 0.080%), Soviet Union (66.4%, a difference of 0.14%), Immigrants from Hong Kong (66.4%, a difference of 0.20%), Immigrants from Korea (66.5%, a difference of 0.27%), and Immigrants from Switzerland (66.5%, a difference of 0.31%).
| Demographics | Rating | Rank | College, 1 year or more |
| Immigrants | Eastern Asia | 100.0 /100 | #17 | Exceptional 66.6% |
| Eastern Europeans | 100.0 /100 | #18 | Exceptional 66.6% |
| Immigrants | Switzerland | 100.0 /100 | #19 | Exceptional 66.5% |
| Immigrants | Korea | 100.0 /100 | #20 | Exceptional 66.5% |
| Immigrants | Hong Kong | 100.0 /100 | #21 | Exceptional 66.4% |
| Soviet Union | 100.0 /100 | #22 | Exceptional 66.4% |
| Immigrants | China | 100.0 /100 | #23 | Exceptional 66.4% |
| Immigrants | Belgium | 100.0 /100 | #24 | Exceptional 66.3% |
| Indians (Asian) | 100.0 /100 | #25 | Exceptional 66.1% |
| Latvians | 100.0 /100 | #26 | Exceptional 66.1% |
| Immigrants | Ireland | 100.0 /100 | #27 | Exceptional 65.9% |
| Immigrants | France | 100.0 /100 | #28 | Exceptional 65.8% |
| Immigrants | Northern Europe | 100.0 /100 | #29 | Exceptional 65.6% |
| Immigrants | Denmark | 100.0 /100 | #30 | Exceptional 65.6% |
| Turks | 100.0 /100 | #31 | Exceptional 65.5% |
Demographics Similar to Immigrants from Poland by College, 1 year or more
In terms of college, 1 year or more, the demographic groups most similar to Immigrants from Poland are Sri Lankan (59.4%, a difference of 0.010%), Tlingit-Haida (59.4%, a difference of 0.030%), Czechoslovakian (59.4%, a difference of 0.030%), Celtic (59.4%, a difference of 0.060%), and Immigrants from Oceania (59.4%, a difference of 0.12%).
| Demographics | Rating | Rank | College, 1 year or more |
| Immigrants | Southern Europe | 52.7 /100 | #169 | Average 59.5% |
| Welsh | 52.4 /100 | #170 | Average 59.5% |
| Immigrants | Albania | 52.3 /100 | #171 | Average 59.5% |
| Immigrants | Sierra Leone | 52.2 /100 | #172 | Average 59.5% |
| Immigrants | Oceania | 51.2 /100 | #173 | Average 59.4% |
| Celtics | 50.0 /100 | #174 | Average 59.4% |
| Sri Lankans | 49.0 /100 | #175 | Average 59.4% |
| Immigrants | Poland | 48.9 /100 | #176 | Average 59.4% |
| Tlingit-Haida | 48.4 /100 | #177 | Average 59.4% |
| Czechoslovakians | 48.3 /100 | #178 | Average 59.4% |
| Bermudans | 46.6 /100 | #179 | Average 59.3% |
| Yugoslavians | 44.1 /100 | #180 | Average 59.2% |
| Swiss | 43.4 /100 | #181 | Average 59.2% |
| Immigrants | Bosnia and Herzegovina | 42.8 /100 | #182 | Average 59.2% |
| German Russians | 39.3 /100 | #183 | Fair 59.1% |