Hawaiian vs Immigrants from Poland College, 1 year or more
COMPARE
Hawaiian
Immigrants from Poland
College, 1 year or more
College, 1 year or more Comparison
Hawaiians
Immigrants from Poland
55.6%
COLLEGE, 1 YEAR OR MORE
0.8/ 100
METRIC RATING
247th/ 347
METRIC RANK
59.4%
COLLEGE, 1 YEAR OR MORE
48.9/ 100
METRIC RATING
176th/ 347
METRIC RANK
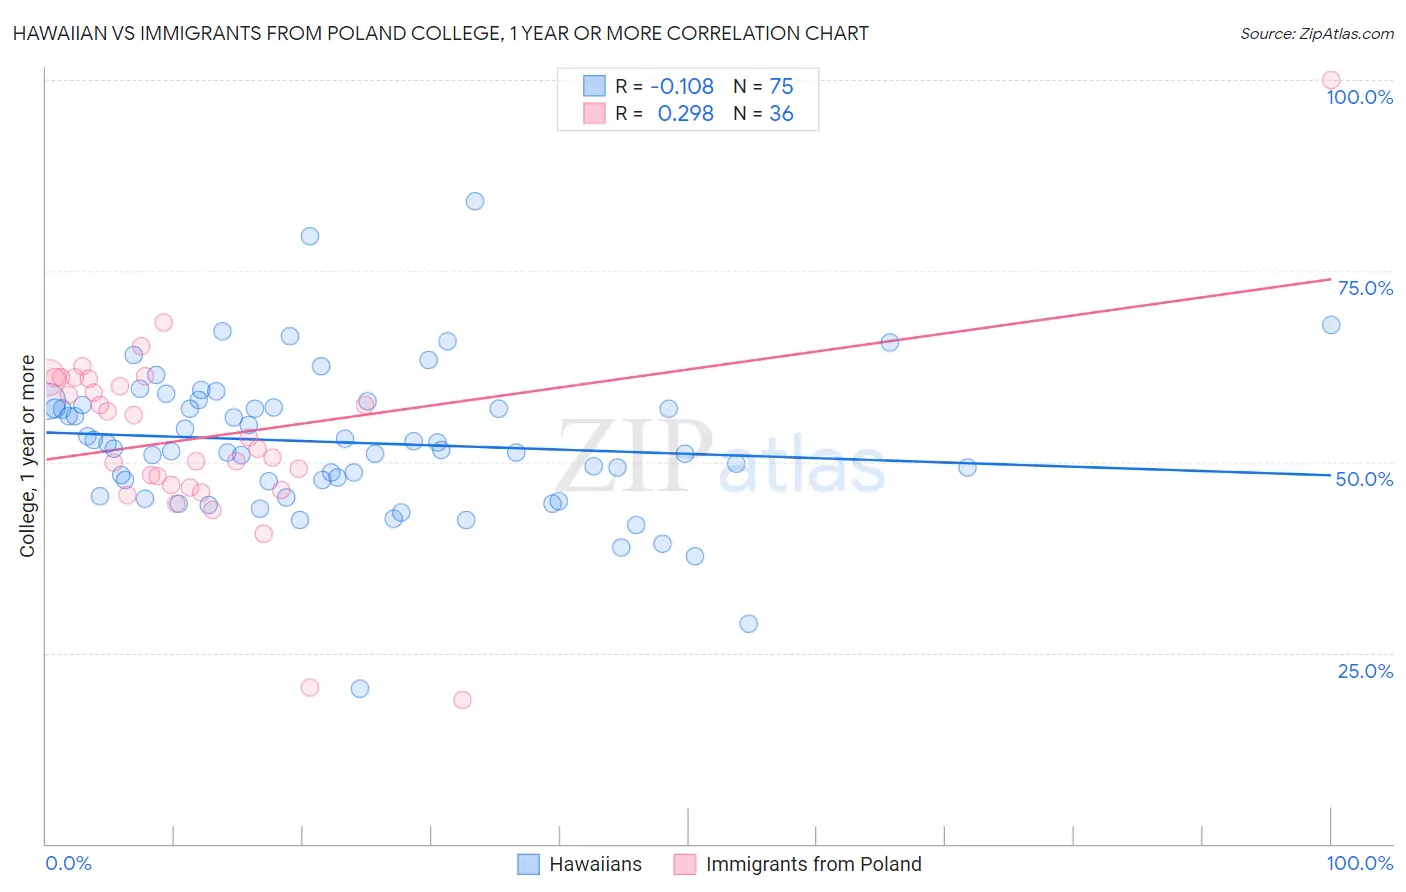
Hawaiian vs Immigrants from Poland College, 1 year or more Correlation Chart
The statistical analysis conducted on geographies consisting of 327,619,549 people shows a poor negative correlation between the proportion of Hawaiians and percentage of population with at least college, 1 year or more education in the United States with a correlation coefficient (R) of -0.108 and weighted average of 55.6%. Similarly, the statistical analysis conducted on geographies consisting of 304,861,916 people shows a weak positive correlation between the proportion of Immigrants from Poland and percentage of population with at least college, 1 year or more education in the United States with a correlation coefficient (R) of 0.298 and weighted average of 59.4%, a difference of 6.8%.
College, 1 year or more Correlation Summary
| Measurement | Hawaiian | Immigrants from Poland |
| Minimum | 20.3% | 18.8% |
| Maximum | 84.1% | 100.0% |
| Range | 63.8% | 81.2% |
| Mean | 52.5% | 53.3% |
| Median | 51.7% | 52.5% |
| Interquartile 25% (IQ1) | 47.5% | 46.8% |
| Interquartile 75% (IQ3) | 57.4% | 60.9% |
| Interquartile Range (IQR) | 9.9% | 14.1% |
| Standard Deviation (Sample) | 9.7% | 13.2% |
| Standard Deviation (Population) | 9.7% | 13.0% |
Similar Demographics by College, 1 year or more
Demographics Similar to Hawaiians by College, 1 year or more
In terms of college, 1 year or more, the demographic groups most similar to Hawaiians are Immigrants from Congo (55.6%, a difference of 0.040%), Malaysian (55.6%, a difference of 0.070%), Immigrants from Liberia (55.7%, a difference of 0.12%), Immigrants from Trinidad and Tobago (55.5%, a difference of 0.13%), and Delaware (55.5%, a difference of 0.16%).
| Demographics | Rating | Rank | College, 1 year or more |
| Trinidadians and Tobagonians | 1.1 /100 | #240 | Tragic 55.8% |
| French American Indians | 1.0 /100 | #241 | Tragic 55.8% |
| Marshallese | 1.0 /100 | #242 | Tragic 55.8% |
| Osage | 1.0 /100 | #243 | Tragic 55.8% |
| Chippewa | 0.9 /100 | #244 | Tragic 55.7% |
| Immigrants | Liberia | 0.8 /100 | #245 | Tragic 55.7% |
| Malaysians | 0.8 /100 | #246 | Tragic 55.6% |
| Hawaiians | 0.8 /100 | #247 | Tragic 55.6% |
| Immigrants | Congo | 0.8 /100 | #248 | Tragic 55.6% |
| Immigrants | Trinidad and Tobago | 0.7 /100 | #249 | Tragic 55.5% |
| Delaware | 0.7 /100 | #250 | Tragic 55.5% |
| Immigrants | Cambodia | 0.6 /100 | #251 | Tragic 55.4% |
| Aleuts | 0.6 /100 | #252 | Tragic 55.4% |
| Immigrants | Barbados | 0.6 /100 | #253 | Tragic 55.4% |
| Japanese | 0.5 /100 | #254 | Tragic 55.2% |
Demographics Similar to Immigrants from Poland by College, 1 year or more
In terms of college, 1 year or more, the demographic groups most similar to Immigrants from Poland are Sri Lankan (59.4%, a difference of 0.010%), Tlingit-Haida (59.4%, a difference of 0.030%), Czechoslovakian (59.4%, a difference of 0.030%), Celtic (59.4%, a difference of 0.060%), and Immigrants from Oceania (59.4%, a difference of 0.12%).
| Demographics | Rating | Rank | College, 1 year or more |
| Immigrants | Southern Europe | 52.7 /100 | #169 | Average 59.5% |
| Welsh | 52.4 /100 | #170 | Average 59.5% |
| Immigrants | Albania | 52.3 /100 | #171 | Average 59.5% |
| Immigrants | Sierra Leone | 52.2 /100 | #172 | Average 59.5% |
| Immigrants | Oceania | 51.2 /100 | #173 | Average 59.4% |
| Celtics | 50.0 /100 | #174 | Average 59.4% |
| Sri Lankans | 49.0 /100 | #175 | Average 59.4% |
| Immigrants | Poland | 48.9 /100 | #176 | Average 59.4% |
| Tlingit-Haida | 48.4 /100 | #177 | Average 59.4% |
| Czechoslovakians | 48.3 /100 | #178 | Average 59.4% |
| Bermudans | 46.6 /100 | #179 | Average 59.3% |
| Yugoslavians | 44.1 /100 | #180 | Average 59.2% |
| Swiss | 43.4 /100 | #181 | Average 59.2% |
| Immigrants | Bosnia and Herzegovina | 42.8 /100 | #182 | Average 59.2% |
| German Russians | 39.3 /100 | #183 | Fair 59.1% |