Welsh vs Swedish Professional Degree
COMPARE
Welsh
Swedish
Professional Degree
Professional Degree Comparison
Welsh
Swedes
4.3%
PROFESSIONAL DEGREE
35.8/ 100
METRIC RATING
185th/ 347
METRIC RANK
4.5%
PROFESSIONAL DEGREE
69.9/ 100
METRIC RATING
156th/ 347
METRIC RANK
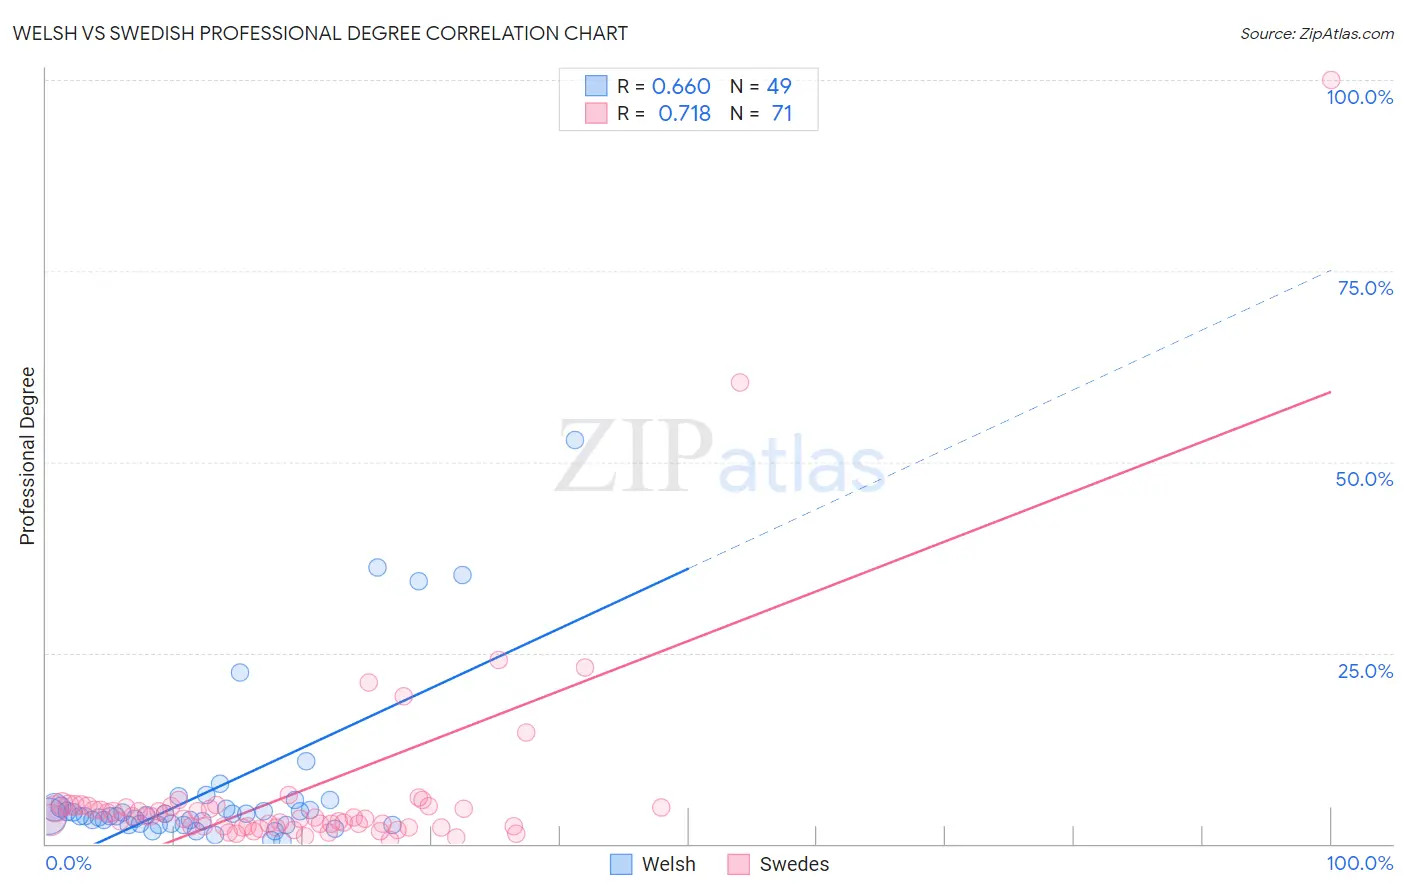
Welsh vs Swedish Professional Degree Correlation Chart
The statistical analysis conducted on geographies consisting of 523,806,417 people shows a significant positive correlation between the proportion of Welsh and percentage of population with at least professional degree education in the United States with a correlation coefficient (R) of 0.660 and weighted average of 4.3%. Similarly, the statistical analysis conducted on geographies consisting of 533,979,460 people shows a strong positive correlation between the proportion of Swedes and percentage of population with at least professional degree education in the United States with a correlation coefficient (R) of 0.718 and weighted average of 4.5%, a difference of 5.3%.
Professional Degree Correlation Summary
| Measurement | Welsh | Swedish |
| Minimum | 0.26% | 0.57% |
| Maximum | 52.8% | 100.0% |
| Range | 52.6% | 99.4% |
| Mean | 7.0% | 6.7% |
| Median | 3.6% | 3.5% |
| Interquartile 25% (IQ1) | 2.5% | 2.3% |
| Interquartile 75% (IQ3) | 4.8% | 5.0% |
| Interquartile Range (IQR) | 2.2% | 2.7% |
| Standard Deviation (Sample) | 10.6% | 13.9% |
| Standard Deviation (Population) | 10.5% | 13.8% |
Similar Demographics by Professional Degree
Demographics Similar to Welsh by Professional Degree
In terms of professional degree, the demographic groups most similar to Welsh are Belgian (4.3%, a difference of 0.060%), Scotch-Irish (4.3%, a difference of 0.27%), Immigrants from Cameroon (4.3%, a difference of 0.42%), Immigrants from Thailand (4.3%, a difference of 0.69%), and Slovak (4.3%, a difference of 0.87%).
| Demographics | Rating | Rank | Professional Degree |
| Immigrants | Costa Rica | 46.7 /100 | #178 | Average 4.4% |
| Immigrants | Kenya | 45.9 /100 | #179 | Average 4.4% |
| Czechs | 44.9 /100 | #180 | Average 4.4% |
| Danes | 43.5 /100 | #181 | Average 4.4% |
| Immigrants | Immigrants | 43.2 /100 | #182 | Average 4.4% |
| Bermudans | 43.1 /100 | #183 | Average 4.4% |
| Belgians | 36.2 /100 | #184 | Fair 4.3% |
| Welsh | 35.8 /100 | #185 | Fair 4.3% |
| Scotch-Irish | 34.2 /100 | #186 | Fair 4.3% |
| Immigrants | Cameroon | 33.3 /100 | #187 | Fair 4.3% |
| Immigrants | Thailand | 31.7 /100 | #188 | Fair 4.3% |
| Slovaks | 30.7 /100 | #189 | Fair 4.3% |
| Immigrants | Poland | 29.2 /100 | #190 | Fair 4.3% |
| Sri Lankans | 29.0 /100 | #191 | Fair 4.3% |
| Ghanaians | 27.3 /100 | #192 | Fair 4.3% |
Demographics Similar to Swedes by Professional Degree
In terms of professional degree, the demographic groups most similar to Swedes are Iraqi (4.5%, a difference of 0.010%), Slavic (4.5%, a difference of 0.15%), Immigrants from Armenia (4.5%, a difference of 0.18%), Vietnamese (4.5%, a difference of 0.26%), and Immigrants from Senegal (4.5%, a difference of 0.32%).
| Demographics | Rating | Rank | Professional Degree |
| Senegalese | 75.3 /100 | #149 | Good 4.6% |
| Immigrants | Oceania | 73.4 /100 | #150 | Good 4.6% |
| Poles | 72.6 /100 | #151 | Good 4.6% |
| Immigrants | Africa | 72.5 /100 | #152 | Good 4.6% |
| Immigrants | Uruguay | 72.5 /100 | #153 | Good 4.6% |
| Scottish | 71.8 /100 | #154 | Good 4.6% |
| Slavs | 70.8 /100 | #155 | Good 4.5% |
| Swedes | 69.9 /100 | #156 | Good 4.5% |
| Iraqis | 69.8 /100 | #157 | Good 4.5% |
| Immigrants | Armenia | 68.8 /100 | #158 | Good 4.5% |
| Vietnamese | 68.4 /100 | #159 | Good 4.5% |
| Immigrants | Senegal | 68.0 /100 | #160 | Good 4.5% |
| Assyrians/Chaldeans/Syriacs | 67.4 /100 | #161 | Good 4.5% |
| Peruvians | 65.2 /100 | #162 | Good 4.5% |
| Sierra Leoneans | 64.3 /100 | #163 | Good 4.5% |