Welsh vs Australian Professional Degree
COMPARE
Welsh
Australian
Professional Degree
Professional Degree Comparison
Welsh
Australians
4.3%
PROFESSIONAL DEGREE
35.8/ 100
METRIC RATING
185th/ 347
METRIC RANK
5.9%
PROFESSIONAL DEGREE
100.0/ 100
METRIC RATING
47th/ 347
METRIC RANK
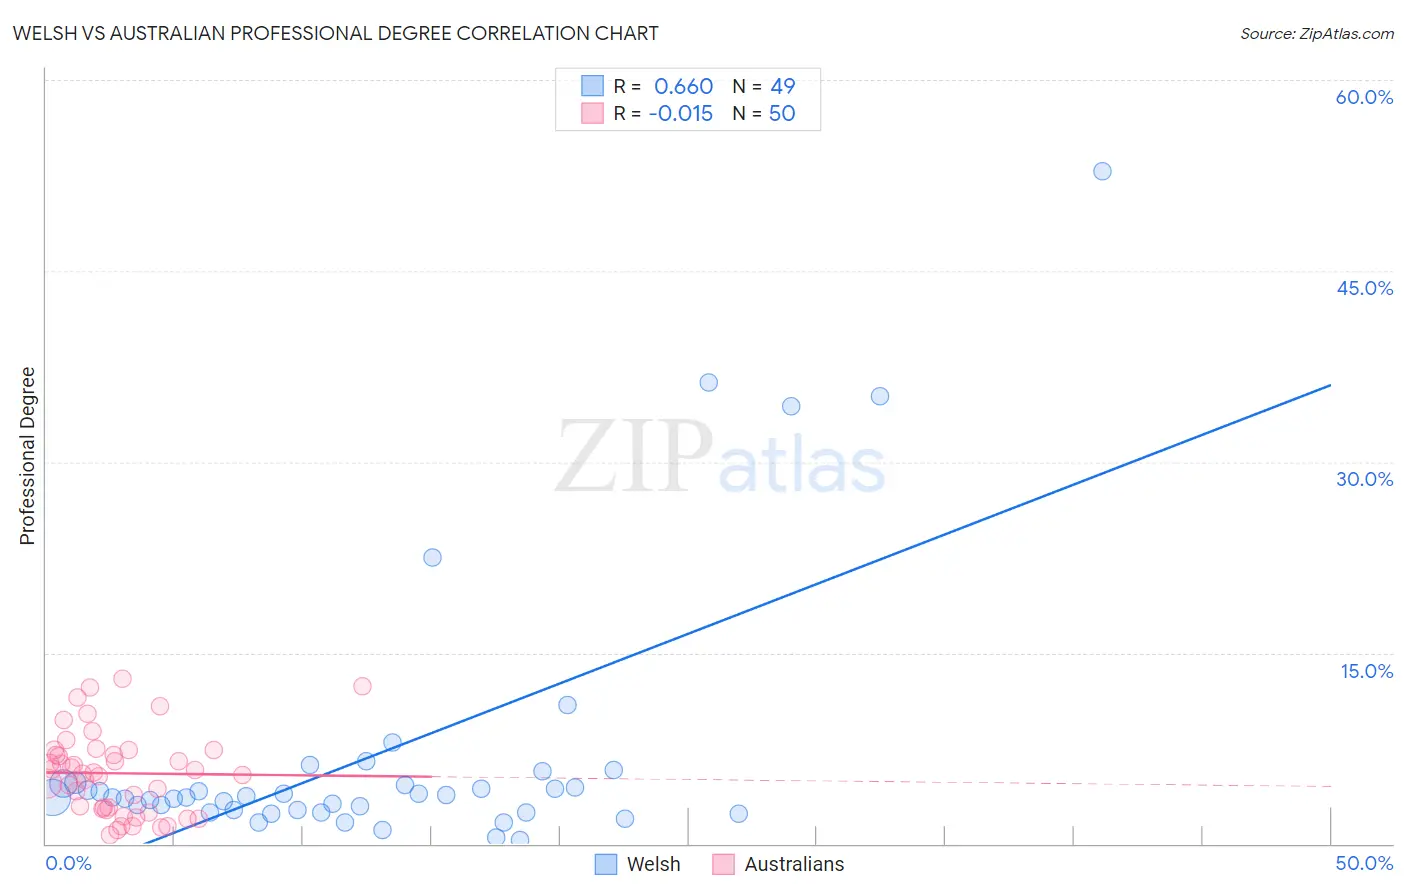
Welsh vs Australian Professional Degree Correlation Chart
The statistical analysis conducted on geographies consisting of 523,806,417 people shows a significant positive correlation between the proportion of Welsh and percentage of population with at least professional degree education in the United States with a correlation coefficient (R) of 0.660 and weighted average of 4.3%. Similarly, the statistical analysis conducted on geographies consisting of 223,901,125 people shows no correlation between the proportion of Australians and percentage of population with at least professional degree education in the United States with a correlation coefficient (R) of -0.015 and weighted average of 5.9%, a difference of 36.5%.
Professional Degree Correlation Summary
| Measurement | Welsh | Australian |
| Minimum | 0.26% | 0.73% |
| Maximum | 52.8% | 12.9% |
| Range | 52.6% | 12.2% |
| Mean | 7.0% | 5.5% |
| Median | 3.6% | 5.5% |
| Interquartile 25% (IQ1) | 2.5% | 2.7% |
| Interquartile 75% (IQ3) | 4.8% | 7.4% |
| Interquartile Range (IQR) | 2.2% | 4.7% |
| Standard Deviation (Sample) | 10.6% | 3.2% |
| Standard Deviation (Population) | 10.5% | 3.2% |
Similar Demographics by Professional Degree
Demographics Similar to Welsh by Professional Degree
In terms of professional degree, the demographic groups most similar to Welsh are Belgian (4.3%, a difference of 0.060%), Scotch-Irish (4.3%, a difference of 0.27%), Immigrants from Cameroon (4.3%, a difference of 0.42%), Immigrants from Thailand (4.3%, a difference of 0.69%), and Slovak (4.3%, a difference of 0.87%).
| Demographics | Rating | Rank | Professional Degree |
| Immigrants | Costa Rica | 46.7 /100 | #178 | Average 4.4% |
| Immigrants | Kenya | 45.9 /100 | #179 | Average 4.4% |
| Czechs | 44.9 /100 | #180 | Average 4.4% |
| Danes | 43.5 /100 | #181 | Average 4.4% |
| Immigrants | Immigrants | 43.2 /100 | #182 | Average 4.4% |
| Bermudans | 43.1 /100 | #183 | Average 4.4% |
| Belgians | 36.2 /100 | #184 | Fair 4.3% |
| Welsh | 35.8 /100 | #185 | Fair 4.3% |
| Scotch-Irish | 34.2 /100 | #186 | Fair 4.3% |
| Immigrants | Cameroon | 33.3 /100 | #187 | Fair 4.3% |
| Immigrants | Thailand | 31.7 /100 | #188 | Fair 4.3% |
| Slovaks | 30.7 /100 | #189 | Fair 4.3% |
| Immigrants | Poland | 29.2 /100 | #190 | Fair 4.3% |
| Sri Lankans | 29.0 /100 | #191 | Fair 4.3% |
| Ghanaians | 27.3 /100 | #192 | Fair 4.3% |
Demographics Similar to Australians by Professional Degree
In terms of professional degree, the demographic groups most similar to Australians are Immigrants from Argentina (5.9%, a difference of 0.010%), Immigrants from South Central Asia (5.9%, a difference of 0.22%), Paraguayan (5.9%, a difference of 0.42%), Argentinean (5.9%, a difference of 0.66%), and Immigrants from Saudi Arabia (5.9%, a difference of 0.82%).
| Demographics | Rating | Rank | Professional Degree |
| Cambodians | 100.0 /100 | #40 | Exceptional 6.0% |
| New Zealanders | 100.0 /100 | #41 | Exceptional 6.0% |
| Estonians | 100.0 /100 | #42 | Exceptional 6.0% |
| Immigrants | Saudi Arabia | 100.0 /100 | #43 | Exceptional 5.9% |
| Argentineans | 100.0 /100 | #44 | Exceptional 5.9% |
| Immigrants | South Central Asia | 100.0 /100 | #45 | Exceptional 5.9% |
| Immigrants | Argentina | 100.0 /100 | #46 | Exceptional 5.9% |
| Australians | 100.0 /100 | #47 | Exceptional 5.9% |
| Paraguayans | 100.0 /100 | #48 | Exceptional 5.9% |
| Immigrants | Latvia | 100.0 /100 | #49 | Exceptional 5.8% |
| Immigrants | Czechoslovakia | 100.0 /100 | #50 | Exceptional 5.8% |
| Immigrants | Greece | 100.0 /100 | #51 | Exceptional 5.8% |
| Immigrants | Serbia | 100.0 /100 | #52 | Exceptional 5.8% |
| Immigrants | Netherlands | 100.0 /100 | #53 | Exceptional 5.8% |
| Immigrants | Kuwait | 100.0 /100 | #54 | Exceptional 5.7% |