Lebanese vs Immigrants from Zaire Professional Degree
COMPARE
Lebanese
Immigrants from Zaire
Professional Degree
Professional Degree Comparison
Lebanese
Immigrants from Zaire
5.0%
PROFESSIONAL DEGREE
98.0/ 100
METRIC RATING
110th/ 347
METRIC RANK
4.5%
PROFESSIONAL DEGREE
57.4/ 100
METRIC RATING
170th/ 347
METRIC RANK
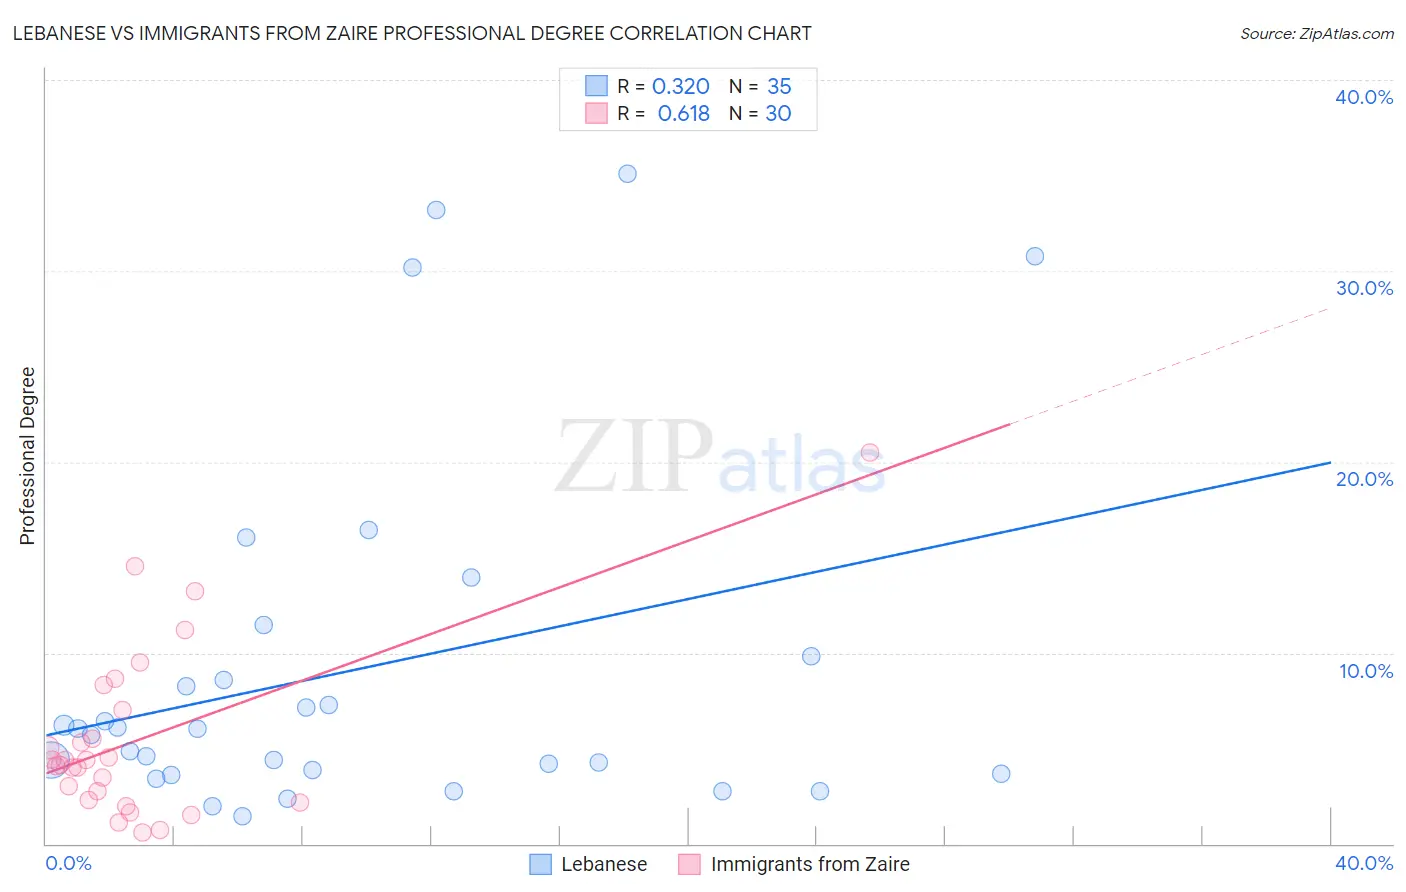
Lebanese vs Immigrants from Zaire Professional Degree Correlation Chart
The statistical analysis conducted on geographies consisting of 400,751,015 people shows a mild positive correlation between the proportion of Lebanese and percentage of population with at least professional degree education in the United States with a correlation coefficient (R) of 0.320 and weighted average of 5.0%. Similarly, the statistical analysis conducted on geographies consisting of 107,228,641 people shows a significant positive correlation between the proportion of Immigrants from Zaire and percentage of population with at least professional degree education in the United States with a correlation coefficient (R) of 0.618 and weighted average of 4.5%, a difference of 12.8%.
Professional Degree Correlation Summary
| Measurement | Lebanese | Immigrants from Zaire |
| Minimum | 1.4% | 0.59% |
| Maximum | 35.1% | 20.5% |
| Range | 33.7% | 19.9% |
| Mean | 9.1% | 5.5% |
| Median | 6.0% | 4.2% |
| Interquartile 25% (IQ1) | 3.6% | 2.3% |
| Interquartile 75% (IQ3) | 9.8% | 7.0% |
| Interquartile Range (IQR) | 6.2% | 4.7% |
| Standard Deviation (Sample) | 9.2% | 4.5% |
| Standard Deviation (Population) | 9.1% | 4.5% |
Similar Demographics by Professional Degree
Demographics Similar to Lebanese by Professional Degree
In terms of professional degree, the demographic groups most similar to Lebanese are British (5.0%, a difference of 0.15%), Immigrants from Southern Europe (5.0%, a difference of 0.16%), Maltese (5.0%, a difference of 0.20%), Immigrants from Ukraine (5.0%, a difference of 0.32%), and Immigrants from Uganda (5.0%, a difference of 0.35%).
| Demographics | Rating | Rank | Professional Degree |
| Immigrants | Northern Africa | 98.4 /100 | #103 | Exceptional 5.1% |
| Arabs | 98.2 /100 | #104 | Exceptional 5.0% |
| Immigrants | Uganda | 98.2 /100 | #105 | Exceptional 5.0% |
| Immigrants | Ukraine | 98.2 /100 | #106 | Exceptional 5.0% |
| Maltese | 98.1 /100 | #107 | Exceptional 5.0% |
| Immigrants | Southern Europe | 98.1 /100 | #108 | Exceptional 5.0% |
| British | 98.0 /100 | #109 | Exceptional 5.0% |
| Lebanese | 98.0 /100 | #110 | Exceptional 5.0% |
| Brazilians | 97.4 /100 | #111 | Exceptional 5.0% |
| Taiwanese | 97.3 /100 | #112 | Exceptional 5.0% |
| Immigrants | Pakistan | 97.2 /100 | #113 | Exceptional 5.0% |
| Immigrants | Morocco | 96.8 /100 | #114 | Exceptional 5.0% |
| Moroccans | 96.8 /100 | #115 | Exceptional 5.0% |
| Venezuelans | 96.3 /100 | #116 | Exceptional 4.9% |
| Immigrants | Syria | 96.0 /100 | #117 | Exceptional 4.9% |
Demographics Similar to Immigrants from Zaire by Professional Degree
In terms of professional degree, the demographic groups most similar to Immigrants from Zaire are Chinese (4.5%, a difference of 0.18%), Immigrants from Sierra Leone (4.5%, a difference of 0.19%), Immigrants from Bangladesh (4.4%, a difference of 0.22%), Immigrants from Afghanistan (4.5%, a difference of 0.26%), and Immigrants from Colombia (4.5%, a difference of 0.29%).
| Demographics | Rating | Rank | Professional Degree |
| Sierra Leoneans | 64.3 /100 | #163 | Good 4.5% |
| Swiss | 61.0 /100 | #164 | Good 4.5% |
| Costa Ricans | 59.9 /100 | #165 | Average 4.5% |
| Immigrants | Colombia | 59.4 /100 | #166 | Average 4.5% |
| Immigrants | Afghanistan | 59.2 /100 | #167 | Average 4.5% |
| Immigrants | Sierra Leone | 58.7 /100 | #168 | Average 4.5% |
| Chinese | 58.6 /100 | #169 | Average 4.5% |
| Immigrants | Zaire | 57.4 /100 | #170 | Average 4.5% |
| Immigrants | Bangladesh | 56.0 /100 | #171 | Average 4.4% |
| Spaniards | 52.0 /100 | #172 | Average 4.4% |
| English | 50.1 /100 | #173 | Average 4.4% |
| Kenyans | 50.0 /100 | #174 | Average 4.4% |
| Irish | 50.0 /100 | #175 | Average 4.4% |
| Immigrants | Peru | 49.3 /100 | #176 | Average 4.4% |
| Celtics | 47.6 /100 | #177 | Average 4.4% |