Welsh vs Immigrants from Haiti College, 1 year or more
COMPARE
Welsh
Immigrants from Haiti
College, 1 year or more
College, 1 year or more Comparison
Welsh
Immigrants from Haiti
59.5%
COLLEGE, 1 YEAR OR MORE
52.4/ 100
METRIC RATING
170th/ 347
METRIC RANK
51.5%
COLLEGE, 1 YEAR OR MORE
0.0/ 100
METRIC RATING
311th/ 347
METRIC RANK
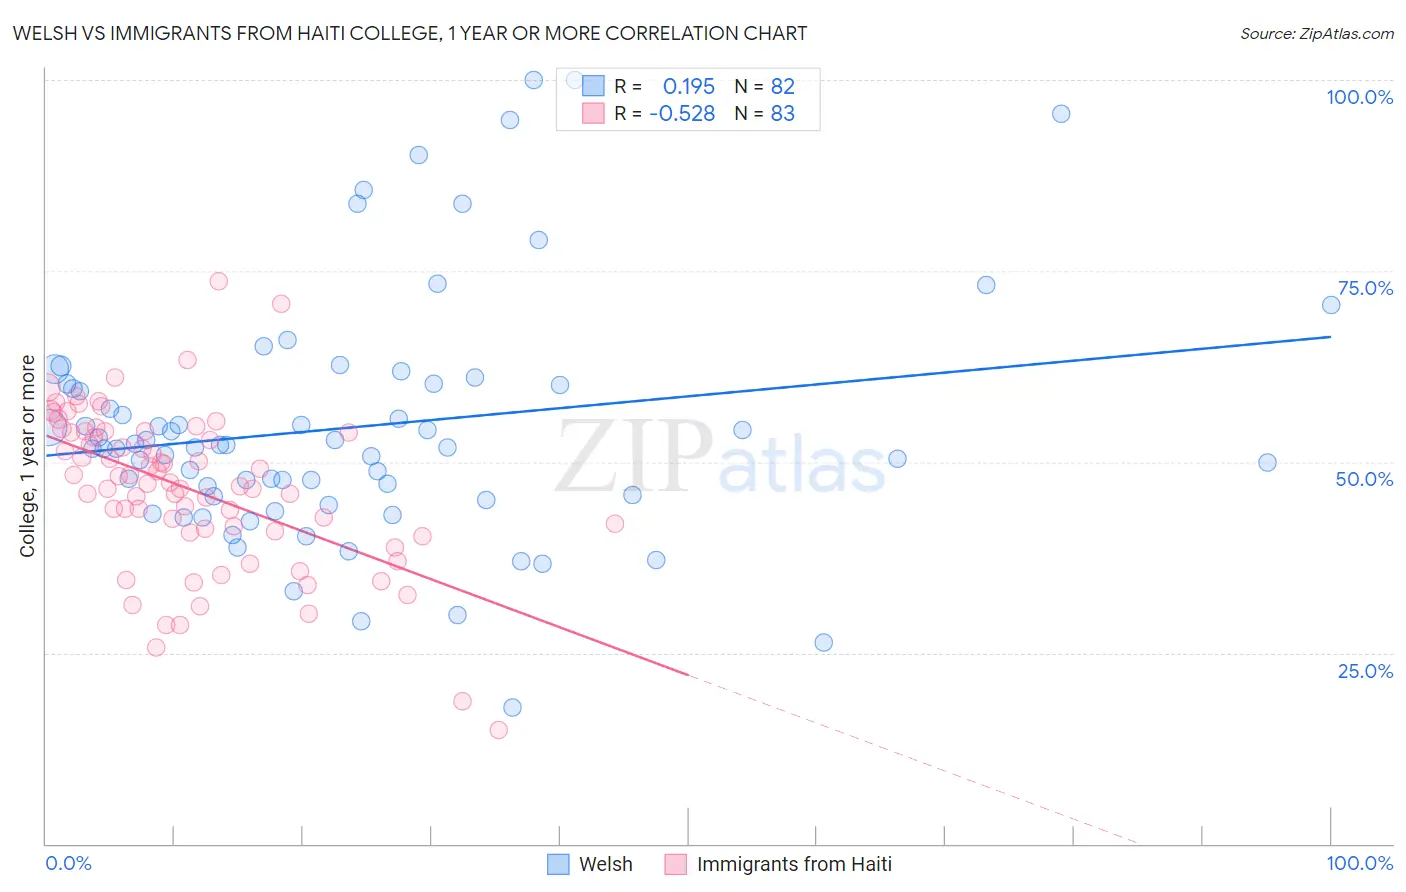
Welsh vs Immigrants from Haiti College, 1 year or more Correlation Chart
The statistical analysis conducted on geographies consisting of 528,593,707 people shows a poor positive correlation between the proportion of Welsh and percentage of population with at least college, 1 year or more education in the United States with a correlation coefficient (R) of 0.195 and weighted average of 59.5%. Similarly, the statistical analysis conducted on geographies consisting of 225,286,245 people shows a substantial negative correlation between the proportion of Immigrants from Haiti and percentage of population with at least college, 1 year or more education in the United States with a correlation coefficient (R) of -0.528 and weighted average of 51.5%, a difference of 15.5%.
College, 1 year or more Correlation Summary
| Measurement | Welsh | Immigrants from Haiti |
| Minimum | 17.8% | 14.8% |
| Maximum | 100.0% | 73.7% |
| Range | 82.2% | 58.9% |
| Mean | 54.6% | 46.5% |
| Median | 52.1% | 47.3% |
| Interquartile 25% (IQ1) | 45.5% | 40.9% |
| Interquartile 75% (IQ3) | 60.2% | 54.0% |
| Interquartile Range (IQR) | 14.7% | 13.0% |
| Standard Deviation (Sample) | 16.1% | 10.5% |
| Standard Deviation (Population) | 16.0% | 10.4% |
Similar Demographics by College, 1 year or more
Demographics Similar to Welsh by College, 1 year or more
In terms of college, 1 year or more, the demographic groups most similar to Welsh are Immigrants from Albania (59.5%, a difference of 0.0%), Immigrants from Sierra Leone (59.5%, a difference of 0.010%), Immigrants from Southern Europe (59.5%, a difference of 0.020%), Hungarian (59.5%, a difference of 0.030%), and Immigrants from North Macedonia (59.5%, a difference of 0.040%).
| Demographics | Rating | Rank | College, 1 year or more |
| Immigrants | Somalia | 58.3 /100 | #163 | Average 59.7% |
| Belgians | 58.1 /100 | #164 | Average 59.7% |
| Irish | 56.1 /100 | #165 | Average 59.6% |
| Immigrants | Africa | 56.1 /100 | #166 | Average 59.6% |
| Immigrants | North Macedonia | 53.1 /100 | #167 | Average 59.5% |
| Hungarians | 52.9 /100 | #168 | Average 59.5% |
| Immigrants | Southern Europe | 52.7 /100 | #169 | Average 59.5% |
| Welsh | 52.4 /100 | #170 | Average 59.5% |
| Immigrants | Albania | 52.3 /100 | #171 | Average 59.5% |
| Immigrants | Sierra Leone | 52.2 /100 | #172 | Average 59.5% |
| Immigrants | Oceania | 51.2 /100 | #173 | Average 59.4% |
| Celtics | 50.0 /100 | #174 | Average 59.4% |
| Sri Lankans | 49.0 /100 | #175 | Average 59.4% |
| Immigrants | Poland | 48.9 /100 | #176 | Average 59.4% |
| Tlingit-Haida | 48.4 /100 | #177 | Average 59.4% |
Demographics Similar to Immigrants from Haiti by College, 1 year or more
In terms of college, 1 year or more, the demographic groups most similar to Immigrants from Haiti are Pueblo (51.5%, a difference of 0.040%), Honduran (51.6%, a difference of 0.16%), Immigrants from Caribbean (51.4%, a difference of 0.17%), Fijian (51.3%, a difference of 0.39%), and Apache (51.8%, a difference of 0.55%).
| Demographics | Rating | Rank | College, 1 year or more |
| Central Americans | 0.0 /100 | #304 | Tragic 52.1% |
| Seminole | 0.0 /100 | #305 | Tragic 52.1% |
| Mexican American Indians | 0.0 /100 | #306 | Tragic 51.9% |
| Immigrants | Portugal | 0.0 /100 | #307 | Tragic 51.9% |
| Salvadorans | 0.0 /100 | #308 | Tragic 51.8% |
| Apache | 0.0 /100 | #309 | Tragic 51.8% |
| Hondurans | 0.0 /100 | #310 | Tragic 51.6% |
| Immigrants | Haiti | 0.0 /100 | #311 | Tragic 51.5% |
| Pueblo | 0.0 /100 | #312 | Tragic 51.5% |
| Immigrants | Caribbean | 0.0 /100 | #313 | Tragic 51.4% |
| Fijians | 0.0 /100 | #314 | Tragic 51.3% |
| Guatemalans | 0.0 /100 | #315 | Tragic 51.2% |
| Cajuns | 0.0 /100 | #316 | Tragic 51.2% |
| Hispanics or Latinos | 0.0 /100 | #317 | Tragic 51.1% |
| Immigrants | Honduras | 0.0 /100 | #318 | Tragic 51.0% |