Welsh vs Immigrants from Haiti GED/Equivalency
COMPARE
Welsh
Immigrants from Haiti
GED/Equivalency
GED/Equivalency Comparison
Welsh
Immigrants from Haiti
87.4%
GED/EQUIVALENCY
97.9/ 100
METRIC RATING
90th/ 347
METRIC RANK
81.6%
GED/EQUIVALENCY
0.0/ 100
METRIC RATING
302nd/ 347
METRIC RANK
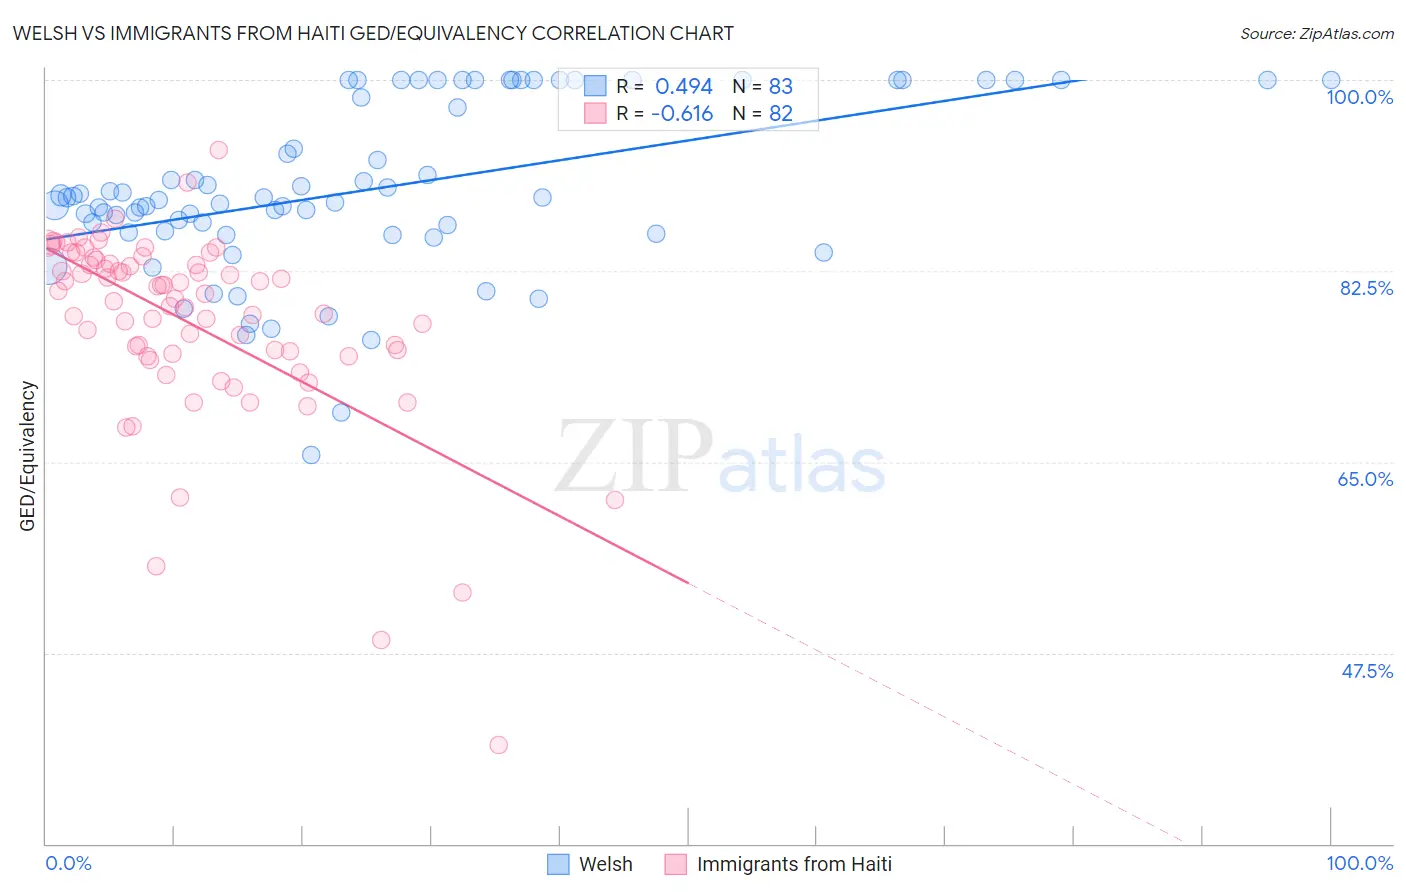
Welsh vs Immigrants from Haiti GED/Equivalency Correlation Chart
The statistical analysis conducted on geographies consisting of 528,596,196 people shows a moderate positive correlation between the proportion of Welsh and percentage of population with at least ged/equivalency education in the United States with a correlation coefficient (R) of 0.494 and weighted average of 87.4%. Similarly, the statistical analysis conducted on geographies consisting of 225,286,636 people shows a significant negative correlation between the proportion of Immigrants from Haiti and percentage of population with at least ged/equivalency education in the United States with a correlation coefficient (R) of -0.616 and weighted average of 81.6%, a difference of 7.2%.
GED/Equivalency Correlation Summary
| Measurement | Welsh | Immigrants from Haiti |
| Minimum | 65.7% | 39.0% |
| Maximum | 100.0% | 93.6% |
| Range | 34.3% | 54.6% |
| Mean | 90.0% | 77.8% |
| Median | 89.2% | 80.2% |
| Interquartile 25% (IQ1) | 86.1% | 74.9% |
| Interquartile 75% (IQ3) | 100.0% | 83.1% |
| Interquartile Range (IQR) | 13.9% | 8.2% |
| Standard Deviation (Sample) | 7.9% | 8.8% |
| Standard Deviation (Population) | 7.8% | 8.8% |
Similar Demographics by GED/Equivalency
Demographics Similar to Welsh by GED/Equivalency
In terms of ged/equivalency, the demographic groups most similar to Welsh are Hungarian (87.4%, a difference of 0.0%), Immigrants from Eastern Asia (87.4%, a difference of 0.010%), Israeli (87.4%, a difference of 0.020%), Immigrants from North Macedonia (87.4%, a difference of 0.030%), and Immigrants from Russia (87.4%, a difference of 0.030%).
| Demographics | Rating | Rank | GED/Equivalency |
| South Africans | 98.3 /100 | #83 | Exceptional 87.5% |
| Immigrants | Romania | 98.1 /100 | #84 | Exceptional 87.5% |
| Dutch | 98.1 /100 | #85 | Exceptional 87.5% |
| Immigrants | Europe | 98.1 /100 | #86 | Exceptional 87.5% |
| Native Hawaiians | 98.1 /100 | #87 | Exceptional 87.5% |
| Immigrants | Norway | 98.1 /100 | #88 | Exceptional 87.5% |
| Hungarians | 97.9 /100 | #89 | Exceptional 87.4% |
| Welsh | 97.9 /100 | #90 | Exceptional 87.4% |
| Immigrants | Eastern Asia | 97.9 /100 | #91 | Exceptional 87.4% |
| Israelis | 97.8 /100 | #92 | Exceptional 87.4% |
| Immigrants | North Macedonia | 97.8 /100 | #93 | Exceptional 87.4% |
| Immigrants | Russia | 97.8 /100 | #94 | Exceptional 87.4% |
| Immigrants | Greece | 97.7 /100 | #95 | Exceptional 87.4% |
| Czechoslovakians | 97.6 /100 | #96 | Exceptional 87.4% |
| Immigrants | Western Europe | 97.3 /100 | #97 | Exceptional 87.3% |
Demographics Similar to Immigrants from Haiti by GED/Equivalency
In terms of ged/equivalency, the demographic groups most similar to Immigrants from Haiti are Immigrants from Portugal (81.6%, a difference of 0.0%), Dutch West Indian (81.6%, a difference of 0.040%), Fijian (81.6%, a difference of 0.10%), Navajo (81.5%, a difference of 0.10%), and Ecuadorian (81.7%, a difference of 0.16%).
| Demographics | Rating | Rank | GED/Equivalency |
| Nepalese | 0.0 /100 | #295 | Tragic 81.9% |
| Vietnamese | 0.0 /100 | #296 | Tragic 81.9% |
| Immigrants | Bangladesh | 0.0 /100 | #297 | Tragic 81.9% |
| Ute | 0.0 /100 | #298 | Tragic 81.8% |
| Ecuadorians | 0.0 /100 | #299 | Tragic 81.7% |
| Fijians | 0.0 /100 | #300 | Tragic 81.6% |
| Dutch West Indians | 0.0 /100 | #301 | Tragic 81.6% |
| Immigrants | Haiti | 0.0 /100 | #302 | Tragic 81.6% |
| Immigrants | Portugal | 0.0 /100 | #303 | Tragic 81.6% |
| Navajo | 0.0 /100 | #304 | Tragic 81.5% |
| Immigrants | Grenada | 0.0 /100 | #305 | Tragic 81.3% |
| Guyanese | 0.0 /100 | #306 | Tragic 81.3% |
| Immigrants | Dominica | 0.0 /100 | #307 | Tragic 81.1% |
| Puerto Ricans | 0.0 /100 | #308 | Tragic 81.1% |
| Immigrants | Ecuador | 0.0 /100 | #309 | Tragic 81.0% |