Immigrants from Zaire vs Immigrants from Haiti College, 1 year or more
COMPARE
Immigrants from Zaire
Immigrants from Haiti
College, 1 year or more
College, 1 year or more Comparison
Immigrants from Zaire
Immigrants from Haiti
58.3%
COLLEGE, 1 YEAR OR MORE
18.7/ 100
METRIC RATING
205th/ 347
METRIC RANK
51.5%
COLLEGE, 1 YEAR OR MORE
0.0/ 100
METRIC RATING
311th/ 347
METRIC RANK
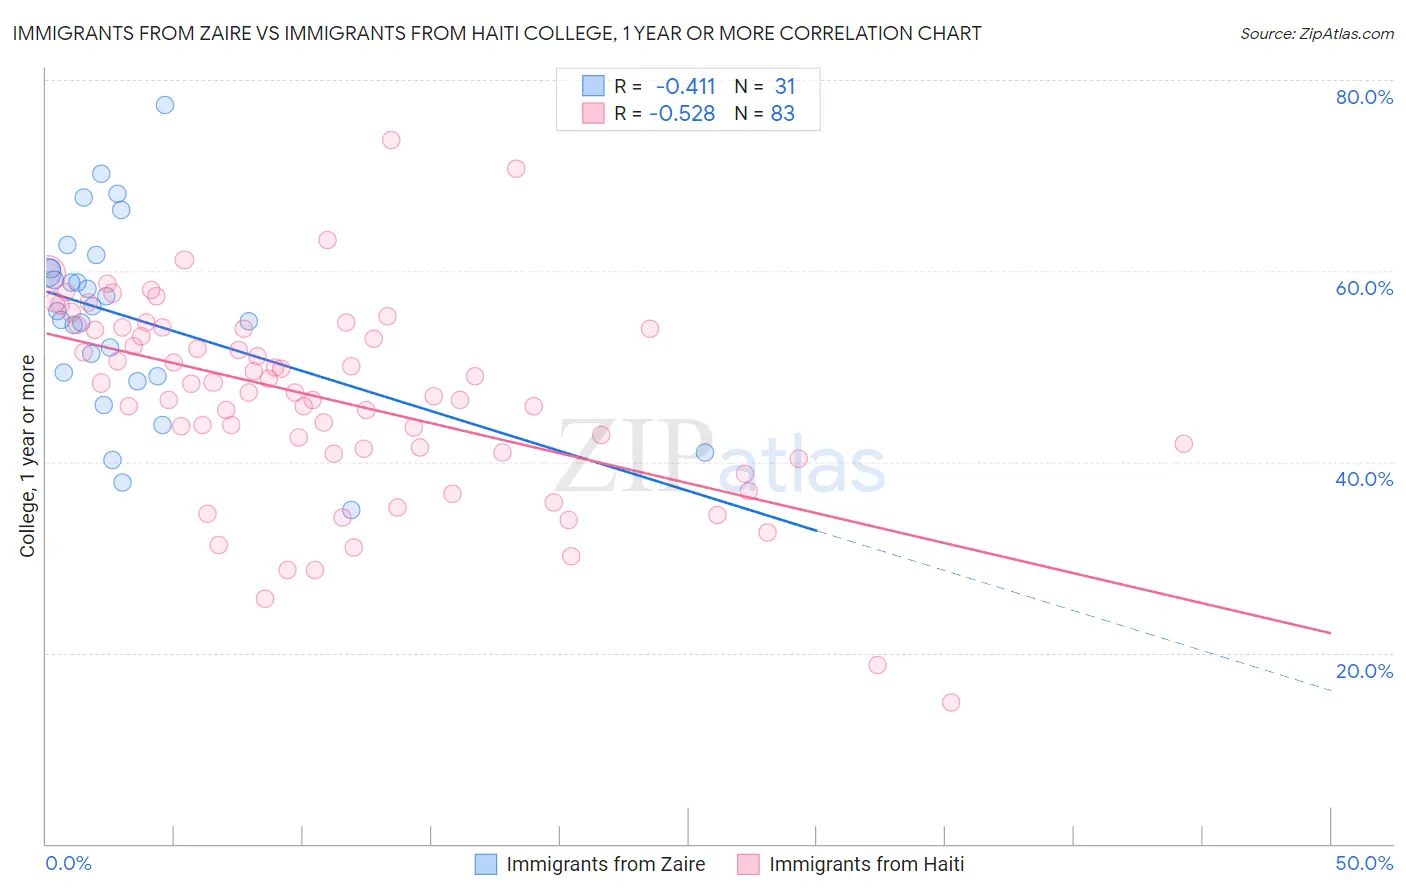
Immigrants from Zaire vs Immigrants from Haiti College, 1 year or more Correlation Chart
The statistical analysis conducted on geographies consisting of 107,255,700 people shows a moderate negative correlation between the proportion of Immigrants from Zaire and percentage of population with at least college, 1 year or more education in the United States with a correlation coefficient (R) of -0.411 and weighted average of 58.3%. Similarly, the statistical analysis conducted on geographies consisting of 225,286,245 people shows a substantial negative correlation between the proportion of Immigrants from Haiti and percentage of population with at least college, 1 year or more education in the United States with a correlation coefficient (R) of -0.528 and weighted average of 51.5%, a difference of 13.1%.
College, 1 year or more Correlation Summary
| Measurement | Immigrants from Zaire | Immigrants from Haiti |
| Minimum | 35.0% | 14.8% |
| Maximum | 77.4% | 73.7% |
| Range | 42.4% | 58.9% |
| Mean | 55.2% | 46.5% |
| Median | 55.8% | 47.3% |
| Interquartile 25% (IQ1) | 48.9% | 40.9% |
| Interquartile 75% (IQ3) | 60.2% | 54.0% |
| Interquartile Range (IQR) | 11.3% | 13.0% |
| Standard Deviation (Sample) | 9.8% | 10.5% |
| Standard Deviation (Population) | 9.6% | 10.4% |
Similar Demographics by College, 1 year or more
Demographics Similar to Immigrants from Zaire by College, 1 year or more
In terms of college, 1 year or more, the demographic groups most similar to Immigrants from Zaire are Immigrants from Vietnam (58.2%, a difference of 0.040%), Panamanian (58.3%, a difference of 0.050%), Senegalese (58.2%, a difference of 0.16%), Ghanaian (58.4%, a difference of 0.19%), and Immigrants from South America (58.4%, a difference of 0.27%).
| Demographics | Rating | Rank | College, 1 year or more |
| Immigrants | South Eastern Asia | 25.1 /100 | #198 | Fair 58.5% |
| Slovaks | 24.6 /100 | #199 | Fair 58.5% |
| Spanish | 24.2 /100 | #200 | Fair 58.5% |
| Nigerians | 23.0 /100 | #201 | Fair 58.5% |
| Immigrants | South America | 21.9 /100 | #202 | Fair 58.4% |
| Ghanaians | 20.9 /100 | #203 | Fair 58.4% |
| Panamanians | 19.2 /100 | #204 | Poor 58.3% |
| Immigrants | Zaire | 18.7 /100 | #205 | Poor 58.3% |
| Immigrants | Vietnam | 18.2 /100 | #206 | Poor 58.2% |
| Senegalese | 16.9 /100 | #207 | Poor 58.2% |
| Immigrants | Uruguay | 15.2 /100 | #208 | Poor 58.1% |
| Immigrants | Middle Africa | 14.0 /100 | #209 | Poor 58.0% |
| Tsimshian | 13.5 /100 | #210 | Poor 57.9% |
| Immigrants | Nigeria | 13.3 /100 | #211 | Poor 57.9% |
| Immigrants | Senegal | 11.8 /100 | #212 | Poor 57.8% |
Demographics Similar to Immigrants from Haiti by College, 1 year or more
In terms of college, 1 year or more, the demographic groups most similar to Immigrants from Haiti are Pueblo (51.5%, a difference of 0.040%), Honduran (51.6%, a difference of 0.16%), Immigrants from Caribbean (51.4%, a difference of 0.17%), Fijian (51.3%, a difference of 0.39%), and Apache (51.8%, a difference of 0.55%).
| Demographics | Rating | Rank | College, 1 year or more |
| Central Americans | 0.0 /100 | #304 | Tragic 52.1% |
| Seminole | 0.0 /100 | #305 | Tragic 52.1% |
| Mexican American Indians | 0.0 /100 | #306 | Tragic 51.9% |
| Immigrants | Portugal | 0.0 /100 | #307 | Tragic 51.9% |
| Salvadorans | 0.0 /100 | #308 | Tragic 51.8% |
| Apache | 0.0 /100 | #309 | Tragic 51.8% |
| Hondurans | 0.0 /100 | #310 | Tragic 51.6% |
| Immigrants | Haiti | 0.0 /100 | #311 | Tragic 51.5% |
| Pueblo | 0.0 /100 | #312 | Tragic 51.5% |
| Immigrants | Caribbean | 0.0 /100 | #313 | Tragic 51.4% |
| Fijians | 0.0 /100 | #314 | Tragic 51.3% |
| Guatemalans | 0.0 /100 | #315 | Tragic 51.2% |
| Cajuns | 0.0 /100 | #316 | Tragic 51.2% |
| Hispanics or Latinos | 0.0 /100 | #317 | Tragic 51.1% |
| Immigrants | Honduras | 0.0 /100 | #318 | Tragic 51.0% |