Immigrants from India vs Immigrants from Haiti College, 1 year or more
COMPARE
Immigrants from India
Immigrants from Haiti
College, 1 year or more
College, 1 year or more Comparison
Immigrants from India
Immigrants from Haiti
69.6%
COLLEGE, 1 YEAR OR MORE
100.0/ 100
METRIC RATING
5th/ 347
METRIC RANK
51.5%
COLLEGE, 1 YEAR OR MORE
0.0/ 100
METRIC RATING
311th/ 347
METRIC RANK
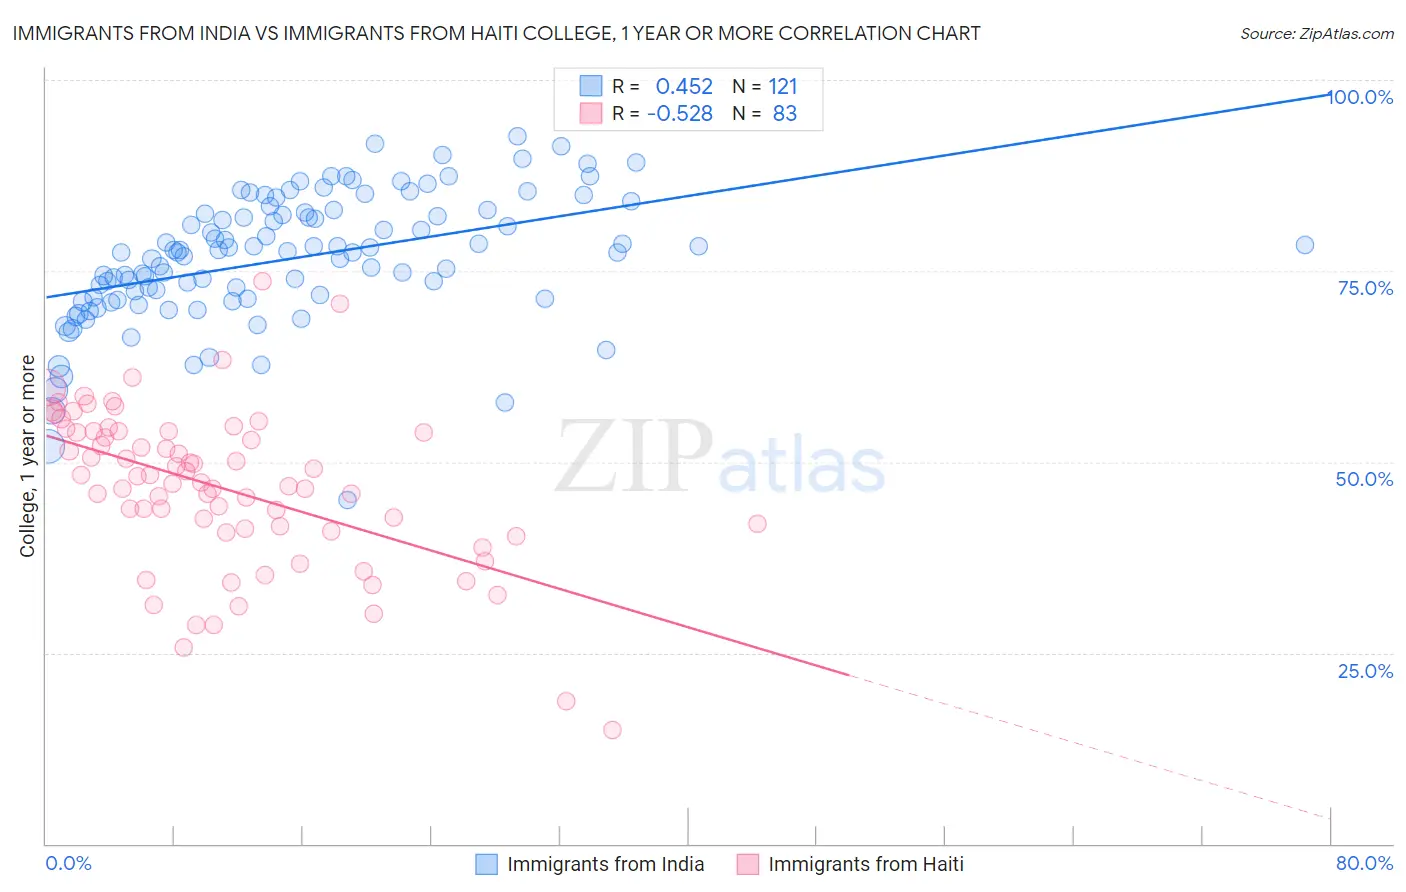
Immigrants from India vs Immigrants from Haiti College, 1 year or more Correlation Chart
The statistical analysis conducted on geographies consisting of 434,099,848 people shows a moderate positive correlation between the proportion of Immigrants from India and percentage of population with at least college, 1 year or more education in the United States with a correlation coefficient (R) of 0.452 and weighted average of 69.6%. Similarly, the statistical analysis conducted on geographies consisting of 225,286,245 people shows a substantial negative correlation between the proportion of Immigrants from Haiti and percentage of population with at least college, 1 year or more education in the United States with a correlation coefficient (R) of -0.528 and weighted average of 51.5%, a difference of 35.2%.
College, 1 year or more Correlation Summary
| Measurement | Immigrants from India | Immigrants from Haiti |
| Minimum | 45.0% | 14.8% |
| Maximum | 92.6% | 73.7% |
| Range | 47.7% | 58.9% |
| Mean | 76.6% | 46.5% |
| Median | 77.4% | 47.3% |
| Interquartile 25% (IQ1) | 71.3% | 40.9% |
| Interquartile 75% (IQ3) | 82.6% | 54.0% |
| Interquartile Range (IQR) | 11.3% | 13.0% |
| Standard Deviation (Sample) | 8.5% | 10.5% |
| Standard Deviation (Population) | 8.5% | 10.4% |
Similar Demographics by College, 1 year or more
Demographics Similar to Immigrants from India by College, 1 year or more
In terms of college, 1 year or more, the demographic groups most similar to Immigrants from India are Immigrants from Taiwan (69.6%, a difference of 0.0%), Immigrants from Iran (69.5%, a difference of 0.20%), Iranian (70.0%, a difference of 0.49%), Immigrants from Singapore (70.1%, a difference of 0.72%), and Okinawan (69.0%, a difference of 0.97%).
| Demographics | Rating | Rank | College, 1 year or more |
| Filipinos | 100.0 /100 | #1 | Exceptional 71.0% |
| Immigrants | Singapore | 100.0 /100 | #2 | Exceptional 70.1% |
| Iranians | 100.0 /100 | #3 | Exceptional 70.0% |
| Immigrants | Taiwan | 100.0 /100 | #4 | Exceptional 69.6% |
| Immigrants | India | 100.0 /100 | #5 | Exceptional 69.6% |
| Immigrants | Iran | 100.0 /100 | #6 | Exceptional 69.5% |
| Okinawans | 100.0 /100 | #7 | Exceptional 69.0% |
| Thais | 100.0 /100 | #8 | Exceptional 68.6% |
| Immigrants | Israel | 100.0 /100 | #9 | Exceptional 67.8% |
| Immigrants | Australia | 100.0 /100 | #10 | Exceptional 67.7% |
| Immigrants | South Central Asia | 100.0 /100 | #11 | Exceptional 67.1% |
| Cypriots | 100.0 /100 | #12 | Exceptional 67.0% |
| Immigrants | Sweden | 100.0 /100 | #13 | Exceptional 66.8% |
| Burmese | 100.0 /100 | #14 | Exceptional 66.7% |
| Cambodians | 100.0 /100 | #15 | Exceptional 66.7% |
Demographics Similar to Immigrants from Haiti by College, 1 year or more
In terms of college, 1 year or more, the demographic groups most similar to Immigrants from Haiti are Pueblo (51.5%, a difference of 0.040%), Honduran (51.6%, a difference of 0.16%), Immigrants from Caribbean (51.4%, a difference of 0.17%), Fijian (51.3%, a difference of 0.39%), and Apache (51.8%, a difference of 0.55%).
| Demographics | Rating | Rank | College, 1 year or more |
| Central Americans | 0.0 /100 | #304 | Tragic 52.1% |
| Seminole | 0.0 /100 | #305 | Tragic 52.1% |
| Mexican American Indians | 0.0 /100 | #306 | Tragic 51.9% |
| Immigrants | Portugal | 0.0 /100 | #307 | Tragic 51.9% |
| Salvadorans | 0.0 /100 | #308 | Tragic 51.8% |
| Apache | 0.0 /100 | #309 | Tragic 51.8% |
| Hondurans | 0.0 /100 | #310 | Tragic 51.6% |
| Immigrants | Haiti | 0.0 /100 | #311 | Tragic 51.5% |
| Pueblo | 0.0 /100 | #312 | Tragic 51.5% |
| Immigrants | Caribbean | 0.0 /100 | #313 | Tragic 51.4% |
| Fijians | 0.0 /100 | #314 | Tragic 51.3% |
| Guatemalans | 0.0 /100 | #315 | Tragic 51.2% |
| Cajuns | 0.0 /100 | #316 | Tragic 51.2% |
| Hispanics or Latinos | 0.0 /100 | #317 | Tragic 51.1% |
| Immigrants | Honduras | 0.0 /100 | #318 | Tragic 51.0% |