Welsh vs Immigrants from Haiti 9th Grade
COMPARE
Welsh
Immigrants from Haiti
9th Grade
9th Grade Comparison
Welsh
Immigrants from Haiti
96.4%
9TH GRADE
100.0/ 100
METRIC RATING
19th/ 347
METRIC RANK
92.7%
9TH GRADE
0.0/ 100
METRIC RATING
301st/ 347
METRIC RANK
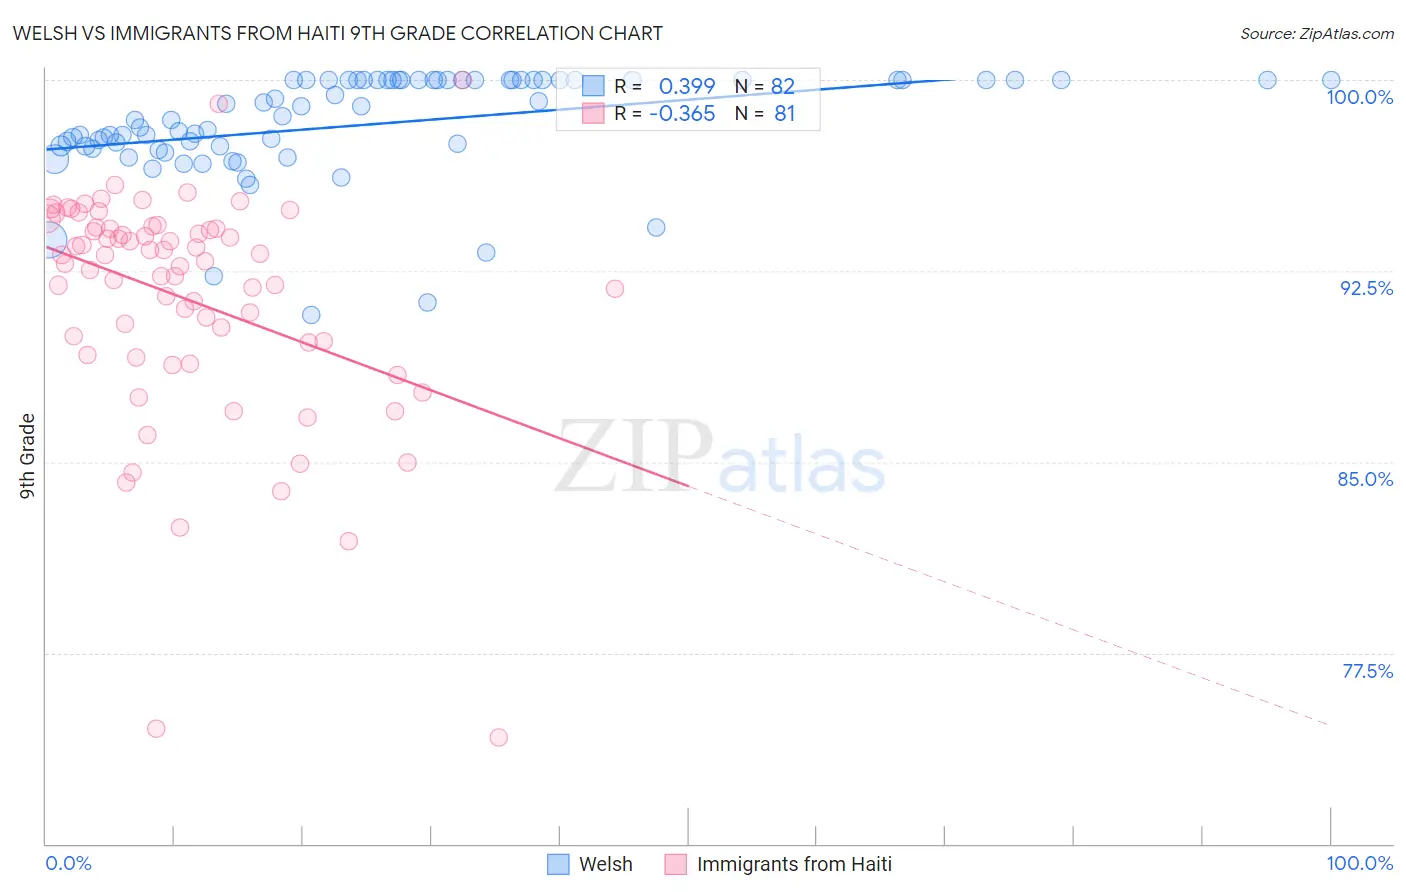
Welsh vs Immigrants from Haiti 9th Grade Correlation Chart
The statistical analysis conducted on geographies consisting of 528,596,253 people shows a mild positive correlation between the proportion of Welsh and percentage of population with at least 9th grade education in the United States with a correlation coefficient (R) of 0.399 and weighted average of 96.4%. Similarly, the statistical analysis conducted on geographies consisting of 225,286,322 people shows a mild negative correlation between the proportion of Immigrants from Haiti and percentage of population with at least 9th grade education in the United States with a correlation coefficient (R) of -0.365 and weighted average of 92.7%, a difference of 4.0%.
9th Grade Correlation Summary
| Measurement | Welsh | Immigrants from Haiti |
| Minimum | 90.8% | 74.2% |
| Maximum | 100.0% | 100.0% |
| Range | 9.2% | 25.8% |
| Mean | 98.2% | 91.4% |
| Median | 98.5% | 92.9% |
| Interquartile 25% (IQ1) | 97.4% | 89.4% |
| Interquartile 75% (IQ3) | 100.0% | 94.2% |
| Interquartile Range (IQR) | 2.6% | 4.7% |
| Standard Deviation (Sample) | 2.1% | 4.5% |
| Standard Deviation (Population) | 2.1% | 4.5% |
Similar Demographics by 9th Grade
Demographics Similar to Welsh by 9th Grade
In terms of 9th grade, the demographic groups most similar to Welsh are Italian (96.4%, a difference of 0.0%), Alaskan Athabascan (96.4%, a difference of 0.020%), European (96.4%, a difference of 0.030%), Scandinavian (96.5%, a difference of 0.040%), and Czech (96.4%, a difference of 0.040%).
| Demographics | Rating | Rank | 9th Grade |
| English | 100.0 /100 | #12 | Exceptional 96.6% |
| Danes | 100.0 /100 | #13 | Exceptional 96.5% |
| Scottish | 100.0 /100 | #14 | Exceptional 96.5% |
| Irish | 100.0 /100 | #15 | Exceptional 96.5% |
| Croatians | 100.0 /100 | #16 | Exceptional 96.5% |
| Dutch | 100.0 /100 | #17 | Exceptional 96.5% |
| Scandinavians | 100.0 /100 | #18 | Exceptional 96.5% |
| Welsh | 100.0 /100 | #19 | Exceptional 96.4% |
| Italians | 100.0 /100 | #20 | Exceptional 96.4% |
| Alaskan Athabascans | 100.0 /100 | #21 | Exceptional 96.4% |
| Europeans | 100.0 /100 | #22 | Exceptional 96.4% |
| Czechs | 100.0 /100 | #23 | Exceptional 96.4% |
| Latvians | 100.0 /100 | #24 | Exceptional 96.4% |
| French | 100.0 /100 | #25 | Exceptional 96.3% |
| French Canadians | 100.0 /100 | #26 | Exceptional 96.3% |
Demographics Similar to Immigrants from Haiti by 9th Grade
In terms of 9th grade, the demographic groups most similar to Immigrants from Haiti are Immigrants from Dominica (92.7%, a difference of 0.080%), Guyanese (92.7%, a difference of 0.10%), Tohono O'odham (92.6%, a difference of 0.12%), Japanese (92.6%, a difference of 0.14%), and Immigrants from Vietnam (92.6%, a difference of 0.15%).
| Demographics | Rating | Rank | 9th Grade |
| Cubans | 0.0 /100 | #294 | Tragic 93.2% |
| Immigrants | Burma/Myanmar | 0.0 /100 | #295 | Tragic 93.1% |
| Indonesians | 0.0 /100 | #296 | Tragic 93.1% |
| Fijians | 0.0 /100 | #297 | Tragic 93.1% |
| Haitians | 0.0 /100 | #298 | Tragic 93.1% |
| Immigrants | Grenada | 0.0 /100 | #299 | Tragic 93.0% |
| Yaqui | 0.0 /100 | #300 | Tragic 92.9% |
| Immigrants | Haiti | 0.0 /100 | #301 | Tragic 92.7% |
| Immigrants | Dominica | 0.0 /100 | #302 | Tragic 92.7% |
| Guyanese | 0.0 /100 | #303 | Tragic 92.7% |
| Tohono O'odham | 0.0 /100 | #304 | Tragic 92.6% |
| Japanese | 0.0 /100 | #305 | Tragic 92.6% |
| Immigrants | Vietnam | 0.0 /100 | #306 | Tragic 92.6% |
| Immigrants | Immigrants | 0.0 /100 | #307 | Tragic 92.5% |
| Immigrants | Guyana | 0.0 /100 | #308 | Tragic 92.5% |