Immigrants from Cameroon vs Immigrants from Haiti College, 1 year or more
COMPARE
Immigrants from Cameroon
Immigrants from Haiti
College, 1 year or more
College, 1 year or more Comparison
Immigrants from Cameroon
Immigrants from Haiti
58.8%
COLLEGE, 1 YEAR OR MORE
31.2/ 100
METRIC RATING
190th/ 347
METRIC RANK
51.5%
COLLEGE, 1 YEAR OR MORE
0.0/ 100
METRIC RATING
311th/ 347
METRIC RANK
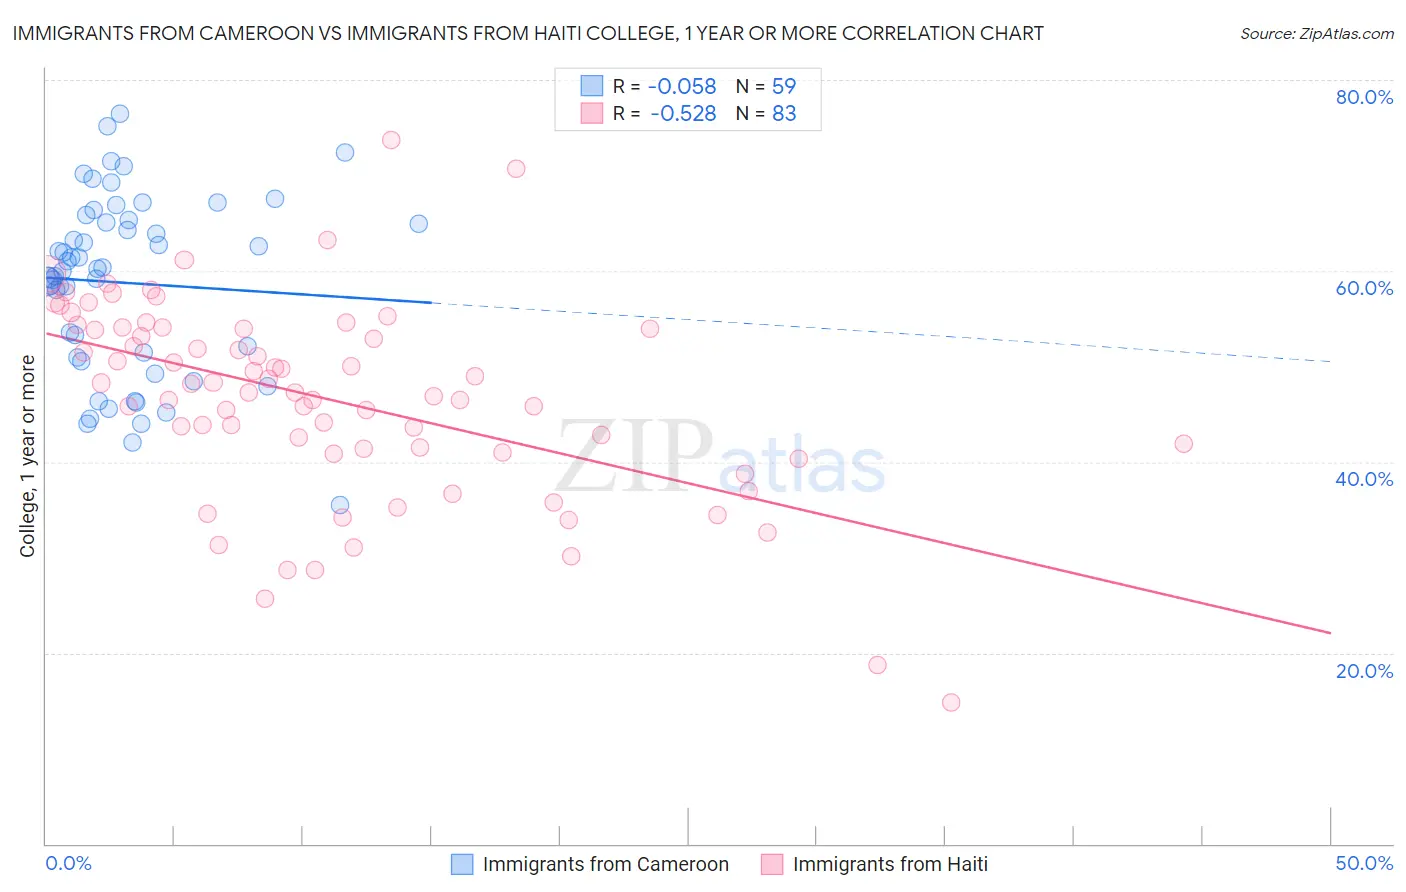
Immigrants from Cameroon vs Immigrants from Haiti College, 1 year or more Correlation Chart
The statistical analysis conducted on geographies consisting of 130,767,721 people shows a slight negative correlation between the proportion of Immigrants from Cameroon and percentage of population with at least college, 1 year or more education in the United States with a correlation coefficient (R) of -0.058 and weighted average of 58.8%. Similarly, the statistical analysis conducted on geographies consisting of 225,286,245 people shows a substantial negative correlation between the proportion of Immigrants from Haiti and percentage of population with at least college, 1 year or more education in the United States with a correlation coefficient (R) of -0.528 and weighted average of 51.5%, a difference of 14.1%.
College, 1 year or more Correlation Summary
| Measurement | Immigrants from Cameroon | Immigrants from Haiti |
| Minimum | 35.5% | 14.8% |
| Maximum | 76.4% | 73.7% |
| Range | 40.9% | 58.9% |
| Mean | 58.7% | 46.5% |
| Median | 60.2% | 47.3% |
| Interquartile 25% (IQ1) | 50.9% | 40.9% |
| Interquartile 75% (IQ3) | 65.4% | 54.0% |
| Interquartile Range (IQR) | 14.5% | 13.0% |
| Standard Deviation (Sample) | 9.3% | 10.5% |
| Standard Deviation (Population) | 9.2% | 10.4% |
Similar Demographics by College, 1 year or more
Demographics Similar to Immigrants from Cameroon by College, 1 year or more
In terms of college, 1 year or more, the demographic groups most similar to Immigrants from Cameroon are Uruguayan (58.8%, a difference of 0.040%), Immigrants from Philippines (58.7%, a difference of 0.13%), French (58.9%, a difference of 0.19%), Scotch-Irish (58.9%, a difference of 0.21%), and German (58.9%, a difference of 0.21%).
| Demographics | Rating | Rank | College, 1 year or more |
| German Russians | 39.3 /100 | #183 | Fair 59.1% |
| Spaniards | 38.3 /100 | #184 | Fair 59.0% |
| South Americans | 35.9 /100 | #185 | Fair 59.0% |
| Scotch-Irish | 34.7 /100 | #186 | Fair 58.9% |
| Germans | 34.7 /100 | #187 | Fair 58.9% |
| French | 34.4 /100 | #188 | Fair 58.9% |
| Uruguayans | 31.8 /100 | #189 | Fair 58.8% |
| Immigrants | Cameroon | 31.2 /100 | #190 | Fair 58.8% |
| Immigrants | Philippines | 29.2 /100 | #191 | Fair 58.7% |
| Colombians | 27.6 /100 | #192 | Fair 58.7% |
| Peruvians | 27.5 /100 | #193 | Fair 58.6% |
| Costa Ricans | 26.4 /100 | #194 | Fair 58.6% |
| Dutch | 26.2 /100 | #195 | Fair 58.6% |
| Guamanians/Chamorros | 26.2 /100 | #196 | Fair 58.6% |
| Immigrants | Thailand | 26.0 /100 | #197 | Fair 58.6% |
Demographics Similar to Immigrants from Haiti by College, 1 year or more
In terms of college, 1 year or more, the demographic groups most similar to Immigrants from Haiti are Pueblo (51.5%, a difference of 0.040%), Honduran (51.6%, a difference of 0.16%), Immigrants from Caribbean (51.4%, a difference of 0.17%), Fijian (51.3%, a difference of 0.39%), and Apache (51.8%, a difference of 0.55%).
| Demographics | Rating | Rank | College, 1 year or more |
| Central Americans | 0.0 /100 | #304 | Tragic 52.1% |
| Seminole | 0.0 /100 | #305 | Tragic 52.1% |
| Mexican American Indians | 0.0 /100 | #306 | Tragic 51.9% |
| Immigrants | Portugal | 0.0 /100 | #307 | Tragic 51.9% |
| Salvadorans | 0.0 /100 | #308 | Tragic 51.8% |
| Apache | 0.0 /100 | #309 | Tragic 51.8% |
| Hondurans | 0.0 /100 | #310 | Tragic 51.6% |
| Immigrants | Haiti | 0.0 /100 | #311 | Tragic 51.5% |
| Pueblo | 0.0 /100 | #312 | Tragic 51.5% |
| Immigrants | Caribbean | 0.0 /100 | #313 | Tragic 51.4% |
| Fijians | 0.0 /100 | #314 | Tragic 51.3% |
| Guatemalans | 0.0 /100 | #315 | Tragic 51.2% |
| Cajuns | 0.0 /100 | #316 | Tragic 51.2% |
| Hispanics or Latinos | 0.0 /100 | #317 | Tragic 51.1% |
| Immigrants | Honduras | 0.0 /100 | #318 | Tragic 51.0% |