Welsh vs Immigrants from Haiti Births to Unmarried Women
COMPARE
Welsh
Immigrants from Haiti
Births to Unmarried Women
Births to Unmarried Women Comparison
Welsh
Immigrants from Haiti
32.0%
BIRTHS TO UNMARRIED WOMEN
38.2/ 100
METRIC RATING
186th/ 347
METRIC RANK
38.9%
BIRTHS TO UNMARRIED WOMEN
0.0/ 100
METRIC RATING
305th/ 347
METRIC RANK
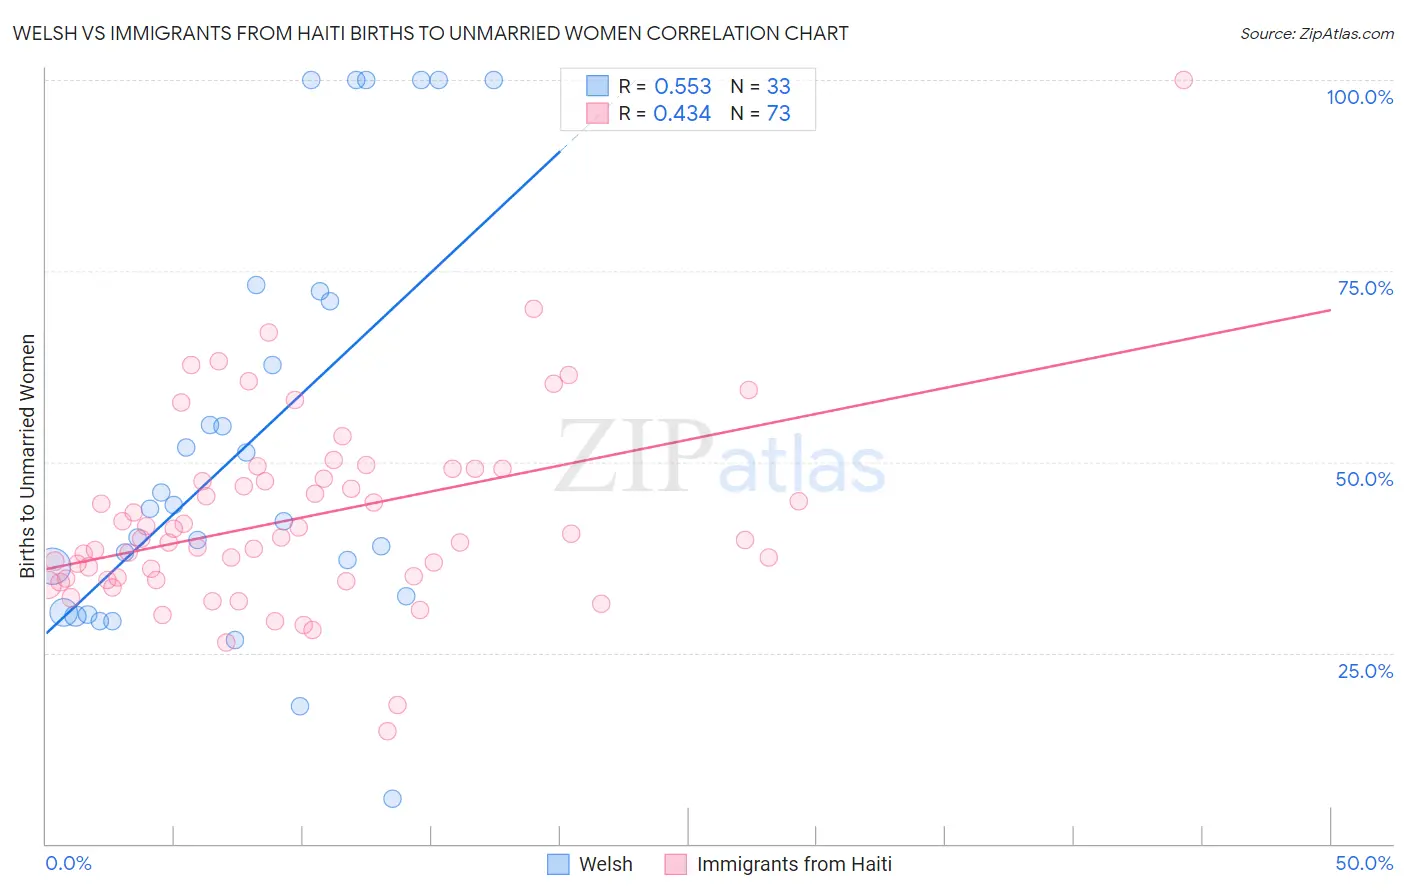
Welsh vs Immigrants from Haiti Births to Unmarried Women Correlation Chart
The statistical analysis conducted on geographies consisting of 474,142,394 people shows a substantial positive correlation between the proportion of Welsh and percentage of births to unmarried women in the United States with a correlation coefficient (R) of 0.553 and weighted average of 32.0%. Similarly, the statistical analysis conducted on geographies consisting of 215,750,595 people shows a moderate positive correlation between the proportion of Immigrants from Haiti and percentage of births to unmarried women in the United States with a correlation coefficient (R) of 0.434 and weighted average of 38.9%, a difference of 21.3%.
Births to Unmarried Women Correlation Summary
| Measurement | Welsh | Immigrants from Haiti |
| Minimum | 5.9% | 14.8% |
| Maximum | 100.0% | 100.0% |
| Range | 94.1% | 85.2% |
| Mean | 52.4% | 42.7% |
| Median | 43.9% | 39.9% |
| Interquartile 25% (IQ1) | 31.3% | 34.7% |
| Interquartile 75% (IQ3) | 71.7% | 48.5% |
| Interquartile Range (IQR) | 40.4% | 13.8% |
| Standard Deviation (Sample) | 27.0% | 12.8% |
| Standard Deviation (Population) | 26.6% | 12.7% |
Similar Demographics by Births to Unmarried Women
Demographics Similar to Welsh by Births to Unmarried Women
In terms of births to unmarried women, the demographic groups most similar to Welsh are Czechoslovakian (32.0%, a difference of 0.020%), Osage (32.1%, a difference of 0.11%), German (32.0%, a difference of 0.13%), Immigrants from Kenya (32.1%, a difference of 0.13%), and Immigrants from South America (32.0%, a difference of 0.24%).
| Demographics | Rating | Rank | Births to Unmarried Women |
| South Americans | 46.9 /100 | #179 | Average 31.8% |
| Moroccans | 45.7 /100 | #180 | Average 31.8% |
| Immigrants | Peru | 45.1 /100 | #181 | Average 31.8% |
| Kenyans | 43.0 /100 | #182 | Average 31.9% |
| Canadians | 41.4 /100 | #183 | Average 31.9% |
| Immigrants | South America | 40.7 /100 | #184 | Average 32.0% |
| Germans | 39.5 /100 | #185 | Fair 32.0% |
| Welsh | 38.2 /100 | #186 | Fair 32.0% |
| Czechoslovakians | 38.0 /100 | #187 | Fair 32.0% |
| Osage | 37.1 /100 | #188 | Fair 32.1% |
| Immigrants | Kenya | 36.9 /100 | #189 | Fair 32.1% |
| Tlingit-Haida | 32.6 /100 | #190 | Fair 32.2% |
| Irish | 32.4 /100 | #191 | Fair 32.2% |
| Colombians | 31.9 /100 | #192 | Fair 32.2% |
| Fijians | 31.1 /100 | #193 | Fair 32.3% |
Demographics Similar to Immigrants from Haiti by Births to Unmarried Women
In terms of births to unmarried women, the demographic groups most similar to Immigrants from Haiti are Yaqui (38.8%, a difference of 0.10%), Immigrants from Jamaica (38.8%, a difference of 0.15%), Central American Indian (39.0%, a difference of 0.29%), Honduran (38.7%, a difference of 0.47%), and Haitian (38.6%, a difference of 0.71%).
| Demographics | Rating | Rank | Births to Unmarried Women |
| Jamaicans | 0.0 /100 | #298 | Tragic 38.5% |
| Spanish Americans | 0.0 /100 | #299 | Tragic 38.6% |
| Immigrants | West Indies | 0.0 /100 | #300 | Tragic 38.6% |
| Haitians | 0.0 /100 | #301 | Tragic 38.6% |
| Hondurans | 0.0 /100 | #302 | Tragic 38.7% |
| Immigrants | Jamaica | 0.0 /100 | #303 | Tragic 38.8% |
| Yaqui | 0.0 /100 | #304 | Tragic 38.8% |
| Immigrants | Haiti | 0.0 /100 | #305 | Tragic 38.9% |
| Central American Indians | 0.0 /100 | #306 | Tragic 39.0% |
| Immigrants | Honduras | 0.0 /100 | #307 | Tragic 39.3% |
| Aleuts | 0.0 /100 | #308 | Tragic 39.3% |
| Cubans | 0.0 /100 | #309 | Tragic 39.4% |
| Immigrants | Dominica | 0.0 /100 | #310 | Tragic 39.5% |
| Immigrants | Azores | 0.0 /100 | #311 | Tragic 39.6% |
| U.S. Virgin Islanders | 0.0 /100 | #312 | Tragic 39.6% |