Welsh vs Colombian College, 1 year or more
COMPARE
Welsh
Colombian
College, 1 year or more
College, 1 year or more Comparison
Welsh
Colombians
59.5%
COLLEGE, 1 YEAR OR MORE
52.4/ 100
METRIC RATING
170th/ 347
METRIC RANK
58.7%
COLLEGE, 1 YEAR OR MORE
27.6/ 100
METRIC RATING
192nd/ 347
METRIC RANK
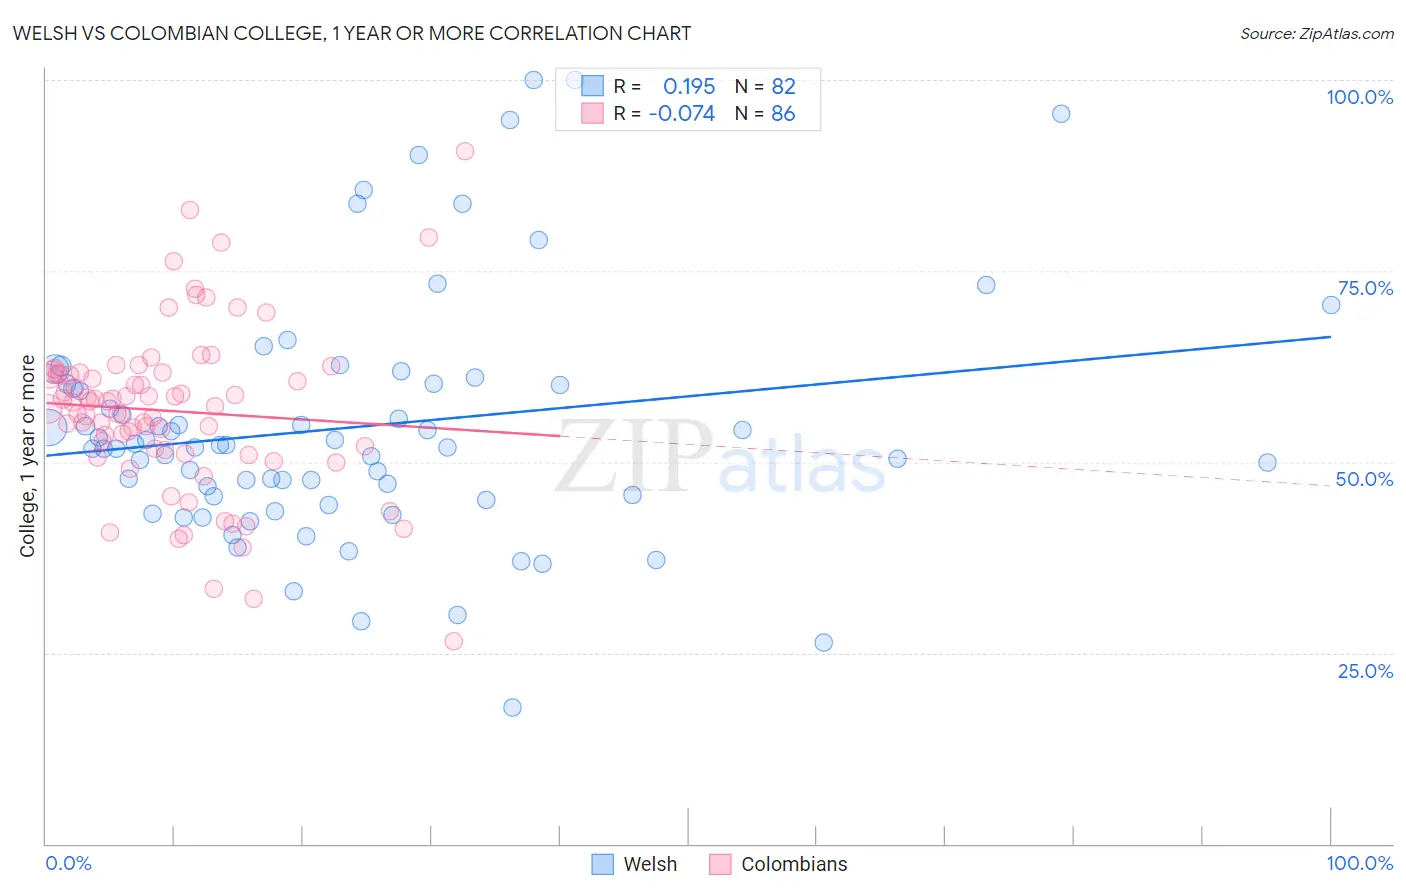
Welsh vs Colombian College, 1 year or more Correlation Chart
The statistical analysis conducted on geographies consisting of 528,593,707 people shows a poor positive correlation between the proportion of Welsh and percentage of population with at least college, 1 year or more education in the United States with a correlation coefficient (R) of 0.195 and weighted average of 59.5%. Similarly, the statistical analysis conducted on geographies consisting of 419,698,522 people shows a slight negative correlation between the proportion of Colombians and percentage of population with at least college, 1 year or more education in the United States with a correlation coefficient (R) of -0.074 and weighted average of 58.7%, a difference of 1.4%.
College, 1 year or more Correlation Summary
| Measurement | Welsh | Colombian |
| Minimum | 17.8% | 26.5% |
| Maximum | 100.0% | 90.7% |
| Range | 82.2% | 64.2% |
| Mean | 54.6% | 56.7% |
| Median | 52.1% | 57.6% |
| Interquartile 25% (IQ1) | 45.5% | 51.5% |
| Interquartile 75% (IQ3) | 60.2% | 61.5% |
| Interquartile Range (IQR) | 14.7% | 10.0% |
| Standard Deviation (Sample) | 16.1% | 10.9% |
| Standard Deviation (Population) | 16.0% | 10.8% |
Similar Demographics by College, 1 year or more
Demographics Similar to Welsh by College, 1 year or more
In terms of college, 1 year or more, the demographic groups most similar to Welsh are Immigrants from Albania (59.5%, a difference of 0.0%), Immigrants from Sierra Leone (59.5%, a difference of 0.010%), Immigrants from Southern Europe (59.5%, a difference of 0.020%), Hungarian (59.5%, a difference of 0.030%), and Immigrants from North Macedonia (59.5%, a difference of 0.040%).
| Demographics | Rating | Rank | College, 1 year or more |
| Immigrants | Somalia | 58.3 /100 | #163 | Average 59.7% |
| Belgians | 58.1 /100 | #164 | Average 59.7% |
| Irish | 56.1 /100 | #165 | Average 59.6% |
| Immigrants | Africa | 56.1 /100 | #166 | Average 59.6% |
| Immigrants | North Macedonia | 53.1 /100 | #167 | Average 59.5% |
| Hungarians | 52.9 /100 | #168 | Average 59.5% |
| Immigrants | Southern Europe | 52.7 /100 | #169 | Average 59.5% |
| Welsh | 52.4 /100 | #170 | Average 59.5% |
| Immigrants | Albania | 52.3 /100 | #171 | Average 59.5% |
| Immigrants | Sierra Leone | 52.2 /100 | #172 | Average 59.5% |
| Immigrants | Oceania | 51.2 /100 | #173 | Average 59.4% |
| Celtics | 50.0 /100 | #174 | Average 59.4% |
| Sri Lankans | 49.0 /100 | #175 | Average 59.4% |
| Immigrants | Poland | 48.9 /100 | #176 | Average 59.4% |
| Tlingit-Haida | 48.4 /100 | #177 | Average 59.4% |
Demographics Similar to Colombians by College, 1 year or more
In terms of college, 1 year or more, the demographic groups most similar to Colombians are Peruvian (58.6%, a difference of 0.010%), Costa Rican (58.6%, a difference of 0.080%), Immigrants from Philippines (58.7%, a difference of 0.10%), Dutch (58.6%, a difference of 0.10%), and Guamanian/Chamorro (58.6%, a difference of 0.10%).
| Demographics | Rating | Rank | College, 1 year or more |
| South Americans | 35.9 /100 | #185 | Fair 59.0% |
| Scotch-Irish | 34.7 /100 | #186 | Fair 58.9% |
| Germans | 34.7 /100 | #187 | Fair 58.9% |
| French | 34.4 /100 | #188 | Fair 58.9% |
| Uruguayans | 31.8 /100 | #189 | Fair 58.8% |
| Immigrants | Cameroon | 31.2 /100 | #190 | Fair 58.8% |
| Immigrants | Philippines | 29.2 /100 | #191 | Fair 58.7% |
| Colombians | 27.6 /100 | #192 | Fair 58.7% |
| Peruvians | 27.5 /100 | #193 | Fair 58.6% |
| Costa Ricans | 26.4 /100 | #194 | Fair 58.6% |
| Dutch | 26.2 /100 | #195 | Fair 58.6% |
| Guamanians/Chamorros | 26.2 /100 | #196 | Fair 58.6% |
| Immigrants | Thailand | 26.0 /100 | #197 | Fair 58.6% |
| Immigrants | South Eastern Asia | 25.1 /100 | #198 | Fair 58.5% |
| Slovaks | 24.6 /100 | #199 | Fair 58.5% |