Carpatho Rusyn vs Immigrants from Guyana Associate's Degree
COMPARE
Carpatho Rusyn
Immigrants from Guyana
Associate's Degree
Associate's Degree Comparison
Carpatho Rusyns
Immigrants from Guyana
50.6%
ASSOCIATE'S DEGREE
99.3/ 100
METRIC RATING
73rd/ 347
METRIC RANK
41.8%
ASSOCIATE'S DEGREE
0.5/ 100
METRIC RATING
255th/ 347
METRIC RANK
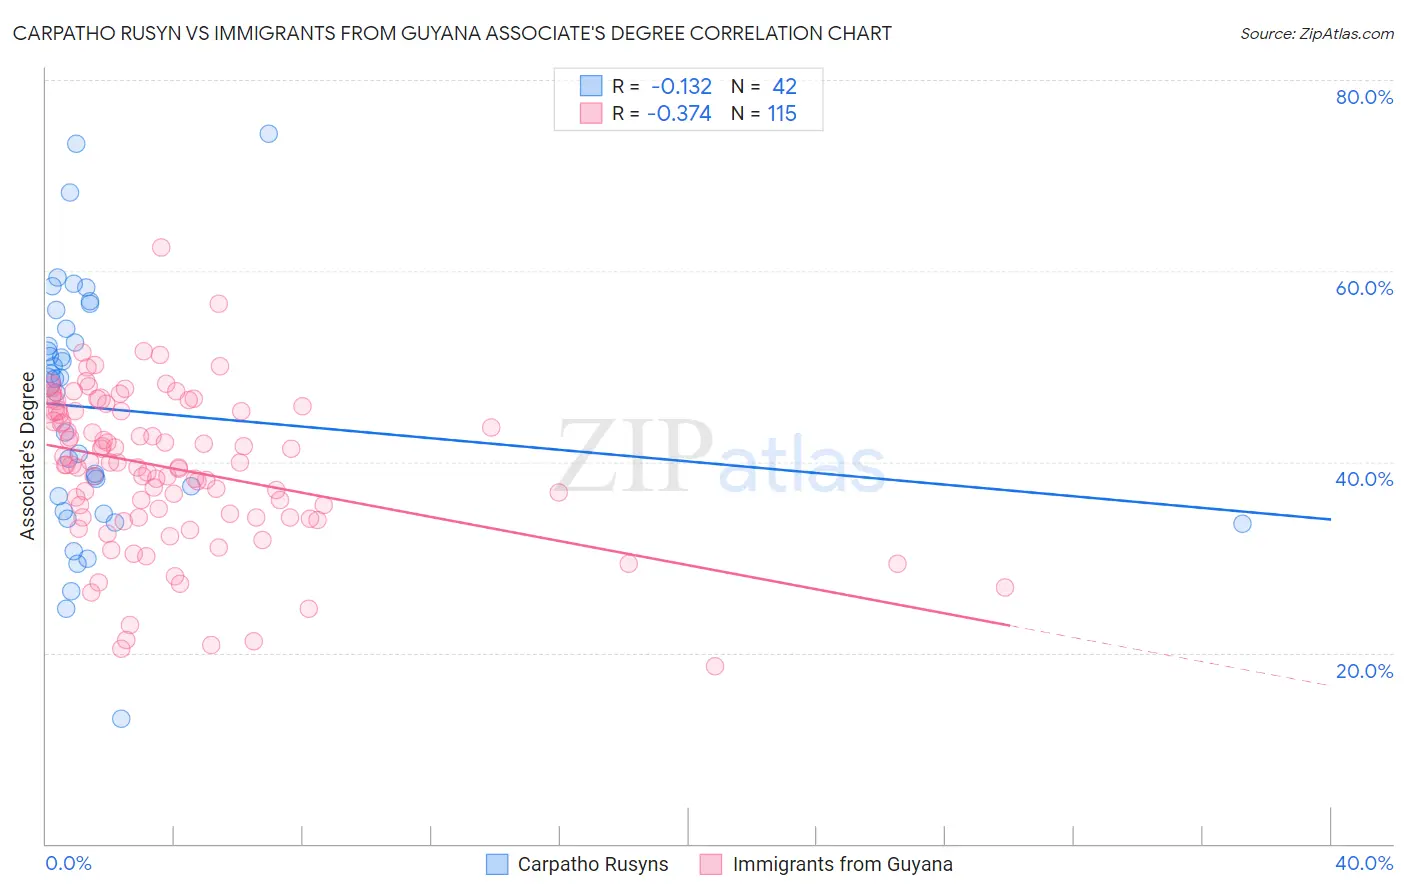
Carpatho Rusyn vs Immigrants from Guyana Associate's Degree Correlation Chart
The statistical analysis conducted on geographies consisting of 58,871,690 people shows a poor negative correlation between the proportion of Carpatho Rusyns and percentage of population with at least associate's degree education in the United States with a correlation coefficient (R) of -0.132 and weighted average of 50.6%. Similarly, the statistical analysis conducted on geographies consisting of 183,738,689 people shows a mild negative correlation between the proportion of Immigrants from Guyana and percentage of population with at least associate's degree education in the United States with a correlation coefficient (R) of -0.374 and weighted average of 41.8%, a difference of 21.0%.
Associate's Degree Correlation Summary
| Measurement | Carpatho Rusyn | Immigrants from Guyana |
| Minimum | 13.2% | 18.6% |
| Maximum | 74.4% | 62.4% |
| Range | 61.2% | 43.8% |
| Mean | 45.6% | 39.3% |
| Median | 48.5% | 39.7% |
| Interquartile 25% (IQ1) | 34.9% | 34.1% |
| Interquartile 75% (IQ3) | 53.9% | 45.3% |
| Interquartile Range (IQR) | 19.0% | 11.2% |
| Standard Deviation (Sample) | 13.2% | 8.0% |
| Standard Deviation (Population) | 13.0% | 8.0% |
Similar Demographics by Associate's Degree
Demographics Similar to Carpatho Rusyns by Associate's Degree
In terms of associate's degree, the demographic groups most similar to Carpatho Rusyns are Lithuanian (50.6%, a difference of 0.060%), Immigrants from Scotland (50.6%, a difference of 0.10%), Immigrants from Zimbabwe (50.5%, a difference of 0.31%), Immigrants from Lebanon (50.5%, a difference of 0.34%), and Immigrants from Eastern Europe (50.5%, a difference of 0.38%).
| Demographics | Rating | Rank | Associate's Degree |
| Immigrants | Europe | 99.7 /100 | #66 | Exceptional 51.3% |
| Argentineans | 99.6 /100 | #67 | Exceptional 51.2% |
| Immigrants | Indonesia | 99.5 /100 | #68 | Exceptional 51.0% |
| Egyptians | 99.5 /100 | #69 | Exceptional 50.9% |
| Immigrants | Argentina | 99.5 /100 | #70 | Exceptional 50.9% |
| Immigrants | Romania | 99.5 /100 | #71 | Exceptional 50.9% |
| Immigrants | Pakistan | 99.5 /100 | #72 | Exceptional 50.9% |
| Carpatho Rusyns | 99.3 /100 | #73 | Exceptional 50.6% |
| Lithuanians | 99.3 /100 | #74 | Exceptional 50.6% |
| Immigrants | Scotland | 99.3 /100 | #75 | Exceptional 50.6% |
| Immigrants | Zimbabwe | 99.2 /100 | #76 | Exceptional 50.5% |
| Immigrants | Lebanon | 99.1 /100 | #77 | Exceptional 50.5% |
| Immigrants | Eastern Europe | 99.1 /100 | #78 | Exceptional 50.5% |
| Ethiopians | 99.1 /100 | #79 | Exceptional 50.4% |
| Armenians | 99.1 /100 | #80 | Exceptional 50.4% |
Demographics Similar to Immigrants from Guyana by Associate's Degree
In terms of associate's degree, the demographic groups most similar to Immigrants from Guyana are Cuban (41.9%, a difference of 0.090%), Immigrants from Congo (41.8%, a difference of 0.12%), Indonesian (41.9%, a difference of 0.15%), Spanish American (41.8%, a difference of 0.18%), and French American Indian (42.0%, a difference of 0.25%).
| Demographics | Rating | Rank | Associate's Degree |
| Immigrants | Ecuador | 0.8 /100 | #248 | Tragic 42.2% |
| Jamaicans | 0.7 /100 | #249 | Tragic 42.1% |
| U.S. Virgin Islanders | 0.7 /100 | #250 | Tragic 42.1% |
| Immigrants | Bahamas | 0.7 /100 | #251 | Tragic 42.1% |
| French American Indians | 0.6 /100 | #252 | Tragic 42.0% |
| Indonesians | 0.6 /100 | #253 | Tragic 41.9% |
| Cubans | 0.6 /100 | #254 | Tragic 41.9% |
| Immigrants | Guyana | 0.5 /100 | #255 | Tragic 41.8% |
| Immigrants | Congo | 0.5 /100 | #256 | Tragic 41.8% |
| Spanish Americans | 0.5 /100 | #257 | Tragic 41.8% |
| Japanese | 0.5 /100 | #258 | Tragic 41.7% |
| Malaysians | 0.4 /100 | #259 | Tragic 41.6% |
| Marshallese | 0.4 /100 | #260 | Tragic 41.6% |
| Nicaraguans | 0.4 /100 | #261 | Tragic 41.5% |
| Bahamians | 0.4 /100 | #262 | Tragic 41.5% |