Vietnamese vs Immigrants from Cuba Doctorate Degree
COMPARE
Vietnamese
Immigrants from Cuba
Doctorate Degree
Doctorate Degree Comparison
Vietnamese
Immigrants from Cuba
1.9%
DOCTORATE DEGREE
54.8/ 100
METRIC RATING
169th/ 347
METRIC RANK
1.2%
DOCTORATE DEGREE
0.0/ 100
METRIC RATING
340th/ 347
METRIC RANK
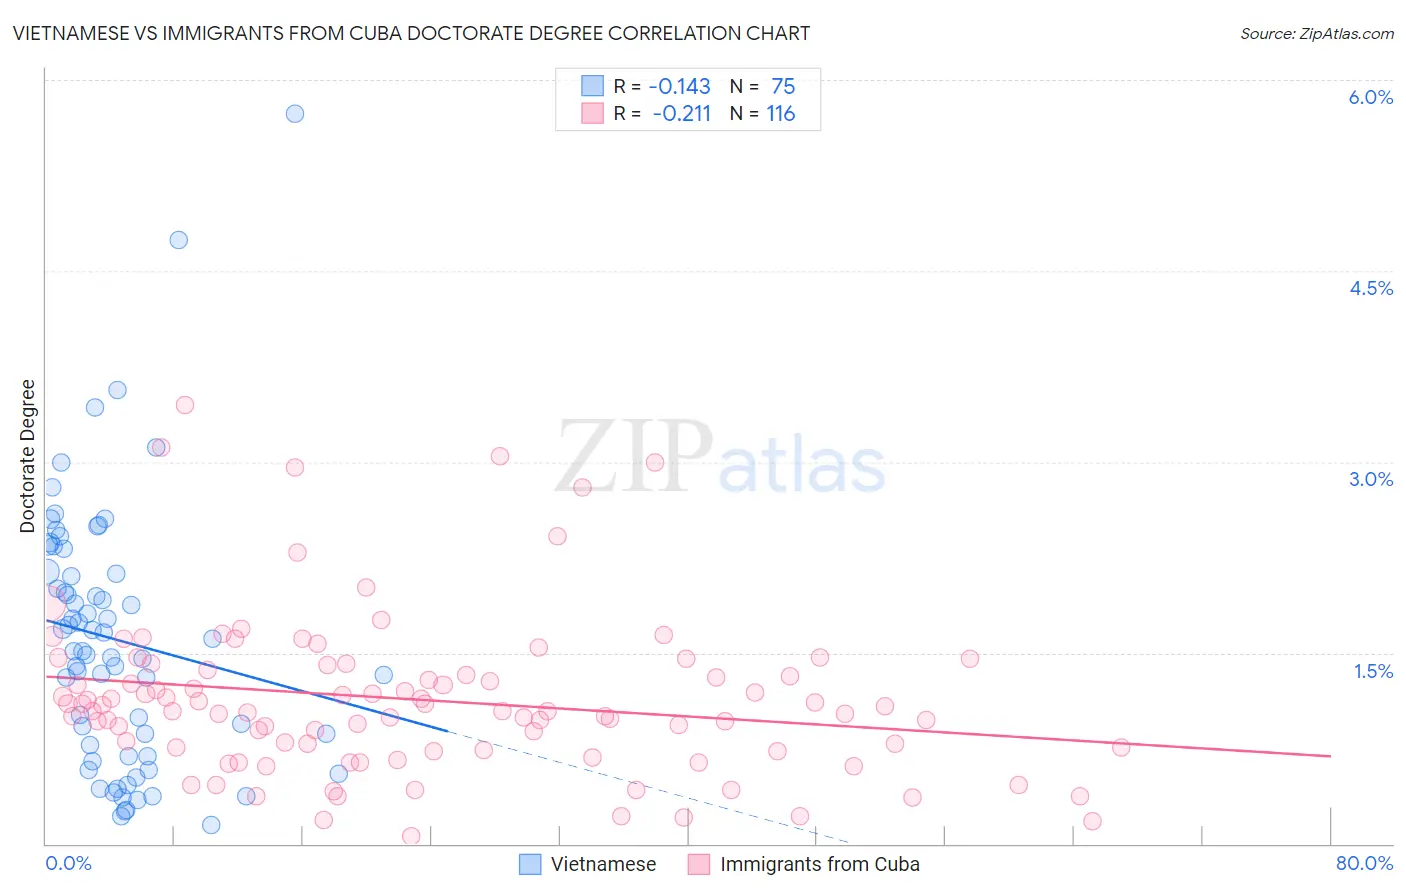
Vietnamese vs Immigrants from Cuba Doctorate Degree Correlation Chart
The statistical analysis conducted on geographies consisting of 170,365,773 people shows a poor negative correlation between the proportion of Vietnamese and percentage of population with at least doctorate degree education in the United States with a correlation coefficient (R) of -0.143 and weighted average of 1.9%. Similarly, the statistical analysis conducted on geographies consisting of 323,189,632 people shows a weak negative correlation between the proportion of Immigrants from Cuba and percentage of population with at least doctorate degree education in the United States with a correlation coefficient (R) of -0.211 and weighted average of 1.2%, a difference of 57.4%.
Doctorate Degree Correlation Summary
| Measurement | Vietnamese | Immigrants from Cuba |
| Minimum | 0.14% | 0.055% |
| Maximum | 5.7% | 3.4% |
| Range | 5.6% | 3.4% |
| Mean | 1.6% | 1.1% |
| Median | 1.5% | 1.0% |
| Interquartile 25% (IQ1) | 0.69% | 0.75% |
| Interquartile 75% (IQ3) | 2.1% | 1.4% |
| Interquartile Range (IQR) | 1.4% | 0.64% |
| Standard Deviation (Sample) | 1.0% | 0.63% |
| Standard Deviation (Population) | 1.0% | 0.63% |
Similar Demographics by Doctorate Degree
Demographics Similar to Vietnamese by Doctorate Degree
In terms of doctorate degree, the demographic groups most similar to Vietnamese are Costa Rican (1.8%, a difference of 0.22%), Bermudan (1.8%, a difference of 0.39%), Belgian (1.8%, a difference of 0.66%), Norwegian (1.8%, a difference of 0.70%), and Immigrants from Bangladesh (1.8%, a difference of 0.70%).
| Demographics | Rating | Rank | Doctorate Degree |
| Irish | 67.5 /100 | #162 | Good 1.9% |
| Czechs | 67.3 /100 | #163 | Good 1.9% |
| Celtics | 66.7 /100 | #164 | Good 1.9% |
| Scotch-Irish | 63.6 /100 | #165 | Good 1.9% |
| Spaniards | 63.5 /100 | #166 | Good 1.9% |
| Macedonians | 60.9 /100 | #167 | Good 1.9% |
| Sri Lankans | 60.3 /100 | #168 | Good 1.9% |
| Vietnamese | 54.8 /100 | #169 | Average 1.9% |
| Costa Ricans | 53.3 /100 | #170 | Average 1.8% |
| Bermudans | 52.1 /100 | #171 | Average 1.8% |
| Belgians | 50.3 /100 | #172 | Average 1.8% |
| Norwegians | 50.0 /100 | #173 | Average 1.8% |
| Immigrants | Bangladesh | 50.0 /100 | #174 | Average 1.8% |
| Immigrants | Thailand | 49.4 /100 | #175 | Average 1.8% |
| Spanish | 49.3 /100 | #176 | Average 1.8% |
Demographics Similar to Immigrants from Cuba by Doctorate Degree
In terms of doctorate degree, the demographic groups most similar to Immigrants from Cuba are Mexican (1.2%, a difference of 0.48%), Immigrants from Central America (1.2%, a difference of 0.81%), Arapaho (1.2%, a difference of 0.86%), Puget Sound Salish (1.2%, a difference of 2.1%), and Bangladeshi (1.2%, a difference of 2.9%).
| Demographics | Rating | Rank | Doctorate Degree |
| Immigrants | Caribbean | 0.0 /100 | #333 | Tragic 1.3% |
| Immigrants | Dominican Republic | 0.0 /100 | #334 | Tragic 1.3% |
| Immigrants | Haiti | 0.0 /100 | #335 | Tragic 1.3% |
| Nepalese | 0.0 /100 | #336 | Tragic 1.3% |
| Bangladeshis | 0.0 /100 | #337 | Tragic 1.2% |
| Puget Sound Salish | 0.0 /100 | #338 | Tragic 1.2% |
| Immigrants | Central America | 0.0 /100 | #339 | Tragic 1.2% |
| Immigrants | Cuba | 0.0 /100 | #340 | Tragic 1.2% |
| Mexicans | 0.0 /100 | #341 | Tragic 1.2% |
| Arapaho | 0.0 /100 | #342 | Tragic 1.2% |
| Fijians | 0.0 /100 | #343 | Tragic 1.1% |
| Immigrants | Mexico | 0.0 /100 | #344 | Tragic 1.1% |
| Lumbee | 0.0 /100 | #345 | Tragic 1.1% |
| Spanish American Indians | 0.0 /100 | #346 | Tragic 1.1% |
| Houma | 0.0 /100 | #347 | Tragic 0.96% |