Vietnamese vs Immigrants from Nepal Doctorate Degree
COMPARE
Vietnamese
Immigrants from Nepal
Doctorate Degree
Doctorate Degree Comparison
Vietnamese
Immigrants from Nepal
1.9%
DOCTORATE DEGREE
54.8/ 100
METRIC RATING
169th/ 347
METRIC RANK
2.2%
DOCTORATE DEGREE
99.3/ 100
METRIC RATING
88th/ 347
METRIC RANK
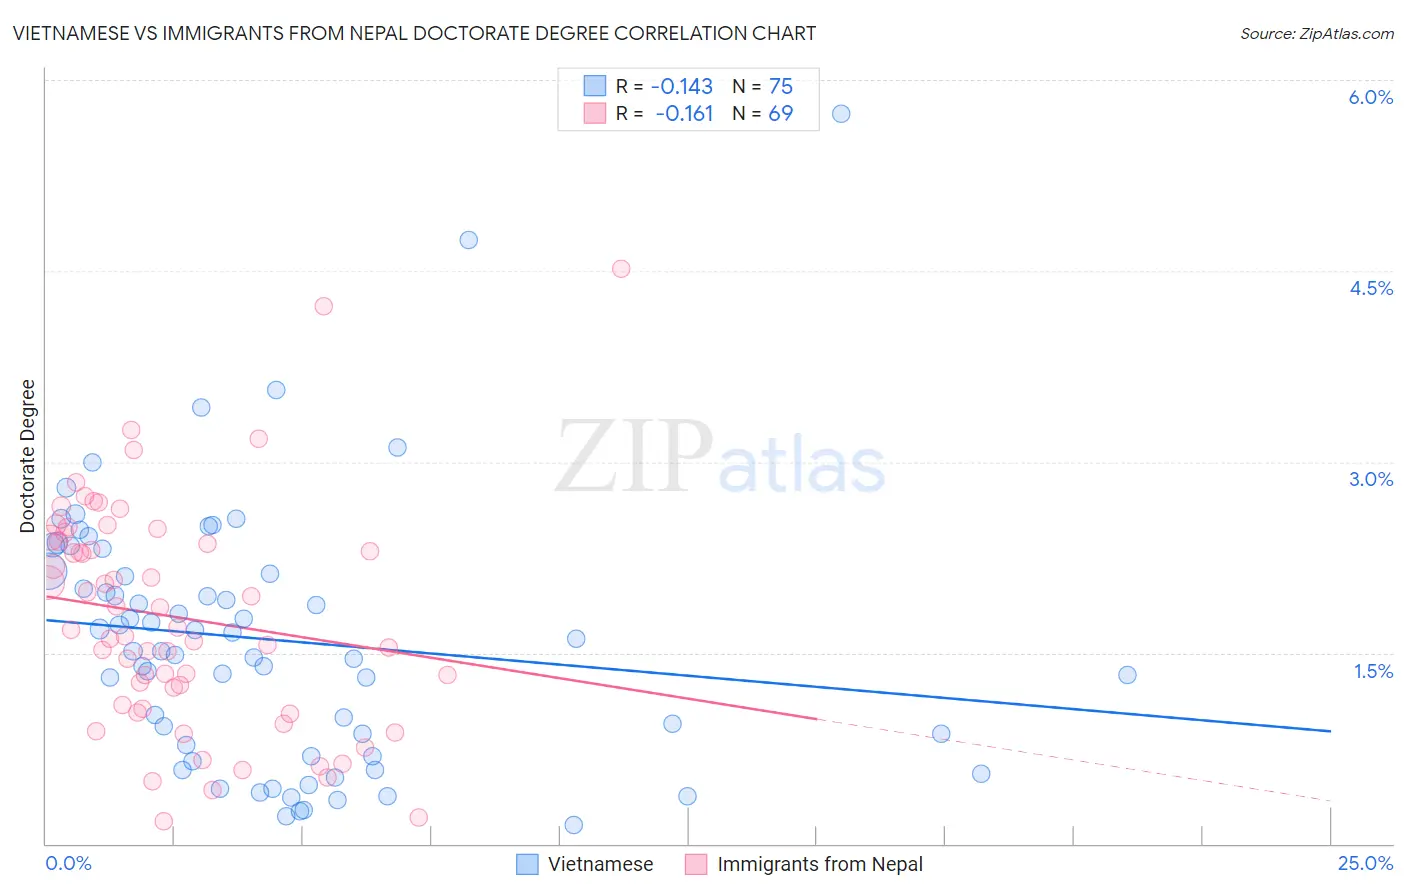
Vietnamese vs Immigrants from Nepal Doctorate Degree Correlation Chart
The statistical analysis conducted on geographies consisting of 170,365,773 people shows a poor negative correlation between the proportion of Vietnamese and percentage of population with at least doctorate degree education in the United States with a correlation coefficient (R) of -0.143 and weighted average of 1.9%. Similarly, the statistical analysis conducted on geographies consisting of 186,268,809 people shows a poor negative correlation between the proportion of Immigrants from Nepal and percentage of population with at least doctorate degree education in the United States with a correlation coefficient (R) of -0.161 and weighted average of 2.2%, a difference of 17.6%.
Doctorate Degree Correlation Summary
| Measurement | Vietnamese | Immigrants from Nepal |
| Minimum | 0.14% | 0.17% |
| Maximum | 5.7% | 4.5% |
| Range | 5.6% | 4.3% |
| Mean | 1.6% | 1.8% |
| Median | 1.5% | 1.7% |
| Interquartile 25% (IQ1) | 0.69% | 1.1% |
| Interquartile 75% (IQ3) | 2.1% | 2.4% |
| Interquartile Range (IQR) | 1.4% | 1.3% |
| Standard Deviation (Sample) | 1.0% | 0.89% |
| Standard Deviation (Population) | 1.0% | 0.88% |
Similar Demographics by Doctorate Degree
Demographics Similar to Vietnamese by Doctorate Degree
In terms of doctorate degree, the demographic groups most similar to Vietnamese are Costa Rican (1.8%, a difference of 0.22%), Bermudan (1.8%, a difference of 0.39%), Belgian (1.8%, a difference of 0.66%), Norwegian (1.8%, a difference of 0.70%), and Immigrants from Bangladesh (1.8%, a difference of 0.70%).
| Demographics | Rating | Rank | Doctorate Degree |
| Irish | 67.5 /100 | #162 | Good 1.9% |
| Czechs | 67.3 /100 | #163 | Good 1.9% |
| Celtics | 66.7 /100 | #164 | Good 1.9% |
| Scotch-Irish | 63.6 /100 | #165 | Good 1.9% |
| Spaniards | 63.5 /100 | #166 | Good 1.9% |
| Macedonians | 60.9 /100 | #167 | Good 1.9% |
| Sri Lankans | 60.3 /100 | #168 | Good 1.9% |
| Vietnamese | 54.8 /100 | #169 | Average 1.9% |
| Costa Ricans | 53.3 /100 | #170 | Average 1.8% |
| Bermudans | 52.1 /100 | #171 | Average 1.8% |
| Belgians | 50.3 /100 | #172 | Average 1.8% |
| Norwegians | 50.0 /100 | #173 | Average 1.8% |
| Immigrants | Bangladesh | 50.0 /100 | #174 | Average 1.8% |
| Immigrants | Thailand | 49.4 /100 | #175 | Average 1.8% |
| Spanish | 49.3 /100 | #176 | Average 1.8% |
Demographics Similar to Immigrants from Nepal by Doctorate Degree
In terms of doctorate degree, the demographic groups most similar to Immigrants from Nepal are Immigrants from Zimbabwe (2.2%, a difference of 0.36%), British (2.2%, a difference of 0.44%), Immigrants from Scotland (2.2%, a difference of 0.45%), Egyptian (2.2%, a difference of 0.47%), and Immigrants from Sudan (2.2%, a difference of 0.93%).
| Demographics | Rating | Rank | Doctorate Degree |
| Immigrants | Argentina | 99.7 /100 | #81 | Exceptional 2.2% |
| Immigrants | Uganda | 99.6 /100 | #82 | Exceptional 2.2% |
| Immigrants | Lithuania | 99.6 /100 | #83 | Exceptional 2.2% |
| Immigrants | England | 99.6 /100 | #84 | Exceptional 2.2% |
| Immigrants | Brazil | 99.6 /100 | #85 | Exceptional 2.2% |
| Egyptians | 99.4 /100 | #86 | Exceptional 2.2% |
| Immigrants | Zimbabwe | 99.4 /100 | #87 | Exceptional 2.2% |
| Immigrants | Nepal | 99.3 /100 | #88 | Exceptional 2.2% |
| British | 99.3 /100 | #89 | Exceptional 2.2% |
| Immigrants | Scotland | 99.2 /100 | #90 | Exceptional 2.2% |
| Immigrants | Sudan | 99.1 /100 | #91 | Exceptional 2.2% |
| Chileans | 99.1 /100 | #92 | Exceptional 2.2% |
| Alsatians | 99.0 /100 | #93 | Exceptional 2.1% |
| Greeks | 98.8 /100 | #94 | Exceptional 2.1% |
| Immigrants | Romania | 98.7 /100 | #95 | Exceptional 2.1% |