Vietnamese vs Immigrants from Jamaica Doctorate Degree
COMPARE
Vietnamese
Immigrants from Jamaica
Doctorate Degree
Doctorate Degree Comparison
Vietnamese
Immigrants from Jamaica
1.9%
DOCTORATE DEGREE
54.8/ 100
METRIC RATING
169th/ 347
METRIC RANK
1.4%
DOCTORATE DEGREE
0.1/ 100
METRIC RATING
310th/ 347
METRIC RANK
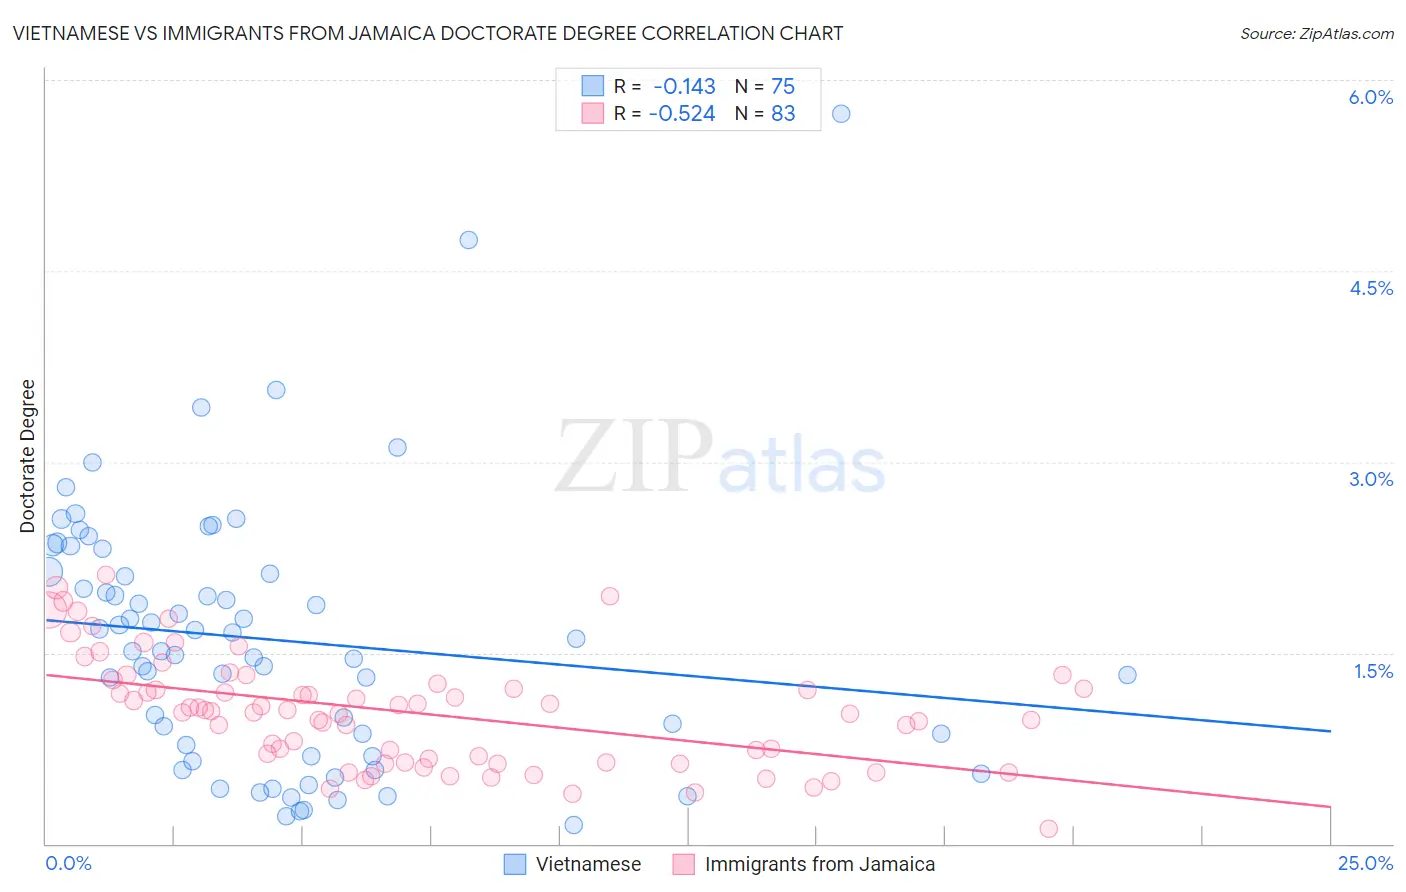
Vietnamese vs Immigrants from Jamaica Doctorate Degree Correlation Chart
The statistical analysis conducted on geographies consisting of 170,365,773 people shows a poor negative correlation between the proportion of Vietnamese and percentage of population with at least doctorate degree education in the United States with a correlation coefficient (R) of -0.143 and weighted average of 1.9%. Similarly, the statistical analysis conducted on geographies consisting of 299,587,727 people shows a substantial negative correlation between the proportion of Immigrants from Jamaica and percentage of population with at least doctorate degree education in the United States with a correlation coefficient (R) of -0.524 and weighted average of 1.4%, a difference of 35.5%.
Doctorate Degree Correlation Summary
| Measurement | Vietnamese | Immigrants from Jamaica |
| Minimum | 0.14% | 0.12% |
| Maximum | 5.7% | 2.1% |
| Range | 5.6% | 2.0% |
| Mean | 1.6% | 1.0% |
| Median | 1.5% | 1.0% |
| Interquartile 25% (IQ1) | 0.69% | 0.64% |
| Interquartile 75% (IQ3) | 2.1% | 1.3% |
| Interquartile Range (IQR) | 1.4% | 0.62% |
| Standard Deviation (Sample) | 1.0% | 0.43% |
| Standard Deviation (Population) | 1.0% | 0.43% |
Similar Demographics by Doctorate Degree
Demographics Similar to Vietnamese by Doctorate Degree
In terms of doctorate degree, the demographic groups most similar to Vietnamese are Costa Rican (1.8%, a difference of 0.22%), Bermudan (1.8%, a difference of 0.39%), Belgian (1.8%, a difference of 0.66%), Norwegian (1.8%, a difference of 0.70%), and Immigrants from Bangladesh (1.8%, a difference of 0.70%).
| Demographics | Rating | Rank | Doctorate Degree |
| Irish | 67.5 /100 | #162 | Good 1.9% |
| Czechs | 67.3 /100 | #163 | Good 1.9% |
| Celtics | 66.7 /100 | #164 | Good 1.9% |
| Scotch-Irish | 63.6 /100 | #165 | Good 1.9% |
| Spaniards | 63.5 /100 | #166 | Good 1.9% |
| Macedonians | 60.9 /100 | #167 | Good 1.9% |
| Sri Lankans | 60.3 /100 | #168 | Good 1.9% |
| Vietnamese | 54.8 /100 | #169 | Average 1.9% |
| Costa Ricans | 53.3 /100 | #170 | Average 1.8% |
| Bermudans | 52.1 /100 | #171 | Average 1.8% |
| Belgians | 50.3 /100 | #172 | Average 1.8% |
| Norwegians | 50.0 /100 | #173 | Average 1.8% |
| Immigrants | Bangladesh | 50.0 /100 | #174 | Average 1.8% |
| Immigrants | Thailand | 49.4 /100 | #175 | Average 1.8% |
| Spanish | 49.3 /100 | #176 | Average 1.8% |
Demographics Similar to Immigrants from Jamaica by Doctorate Degree
In terms of doctorate degree, the demographic groups most similar to Immigrants from Jamaica are Immigrants from Honduras (1.4%, a difference of 0.18%), Immigrants from Grenada (1.4%, a difference of 0.30%), Immigrants from Nicaragua (1.4%, a difference of 0.55%), Immigrants from Laos (1.4%, a difference of 0.71%), and Cuban (1.4%, a difference of 0.76%).
| Demographics | Rating | Rank | Doctorate Degree |
| Immigrants | Dominica | 0.1 /100 | #303 | Tragic 1.4% |
| Mexican American Indians | 0.1 /100 | #304 | Tragic 1.4% |
| Pennsylvania Germans | 0.1 /100 | #305 | Tragic 1.4% |
| Guyanese | 0.1 /100 | #306 | Tragic 1.4% |
| Cubans | 0.1 /100 | #307 | Tragic 1.4% |
| Immigrants | Laos | 0.1 /100 | #308 | Tragic 1.4% |
| Immigrants | Grenada | 0.1 /100 | #309 | Tragic 1.4% |
| Immigrants | Jamaica | 0.1 /100 | #310 | Tragic 1.4% |
| Immigrants | Honduras | 0.1 /100 | #311 | Tragic 1.4% |
| Immigrants | Nicaragua | 0.1 /100 | #312 | Tragic 1.4% |
| Menominee | 0.1 /100 | #313 | Tragic 1.4% |
| Dominicans | 0.1 /100 | #314 | Tragic 1.4% |
| Immigrants | Azores | 0.1 /100 | #315 | Tragic 1.4% |
| Navajo | 0.1 /100 | #316 | Tragic 1.4% |
| Immigrants | Micronesia | 0.1 /100 | #317 | Tragic 1.3% |