Immigrants from St. Vincent and the Grenadines vs Immigrants from Cuba Doctorate Degree
COMPARE
Immigrants from St. Vincent and the Grenadines
Immigrants from Cuba
Doctorate Degree
Doctorate Degree Comparison
Immigrants from St. Vincent and the Grenadines
Immigrants from Cuba
1.3%
DOCTORATE DEGREE
0.1/ 100
METRIC RATING
320th/ 347
METRIC RANK
1.2%
DOCTORATE DEGREE
0.0/ 100
METRIC RATING
340th/ 347
METRIC RANK
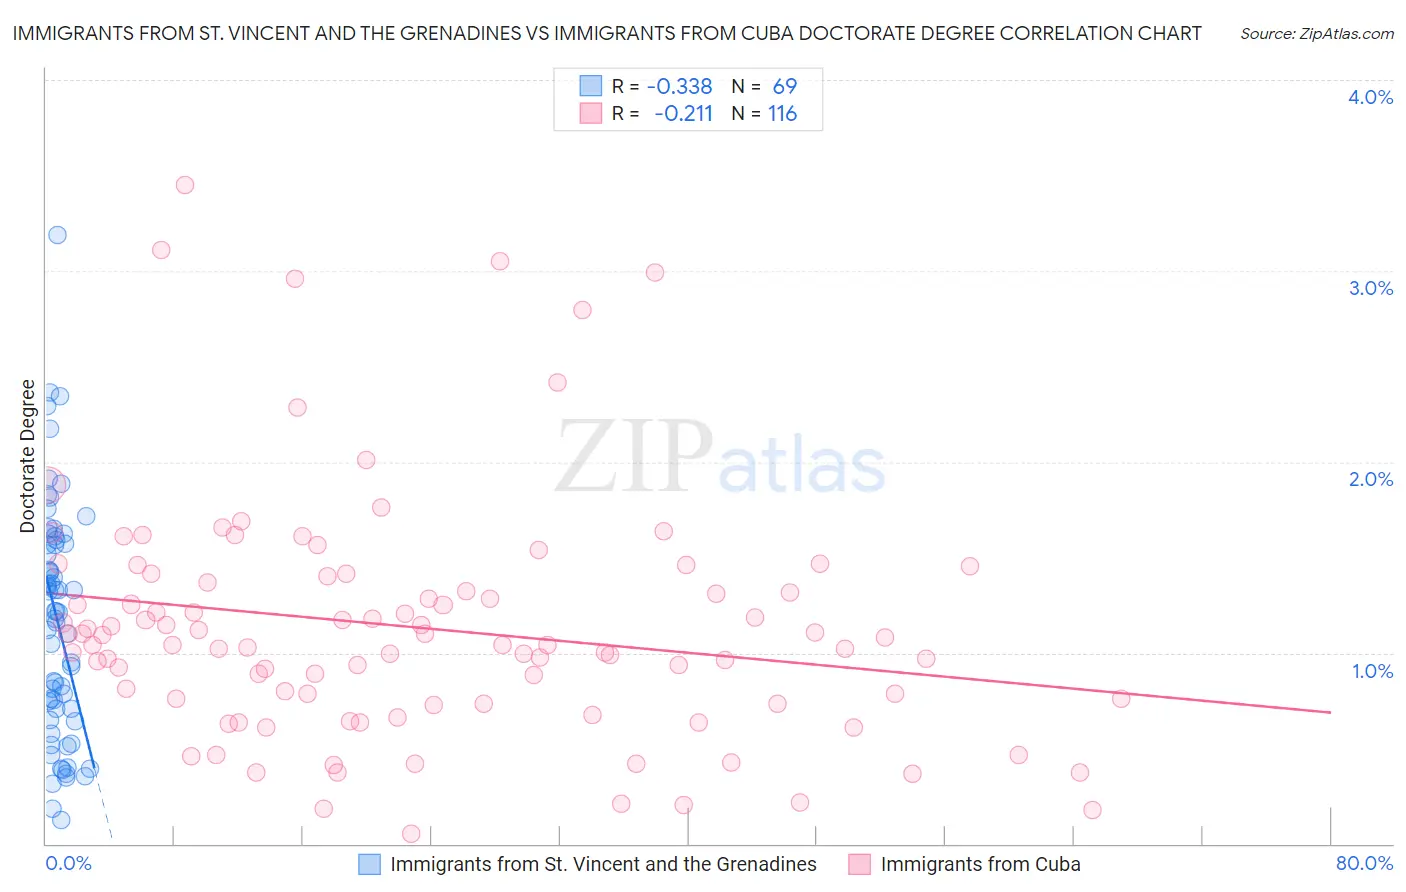
Immigrants from St. Vincent and the Grenadines vs Immigrants from Cuba Doctorate Degree Correlation Chart
The statistical analysis conducted on geographies consisting of 56,078,344 people shows a mild negative correlation between the proportion of Immigrants from St. Vincent and the Grenadines and percentage of population with at least doctorate degree education in the United States with a correlation coefficient (R) of -0.338 and weighted average of 1.3%. Similarly, the statistical analysis conducted on geographies consisting of 323,189,632 people shows a weak negative correlation between the proportion of Immigrants from Cuba and percentage of population with at least doctorate degree education in the United States with a correlation coefficient (R) of -0.211 and weighted average of 1.2%, a difference of 13.3%.
Doctorate Degree Correlation Summary
| Measurement | Immigrants from St. Vincent and the Grenadines | Immigrants from Cuba |
| Minimum | 0.13% | 0.055% |
| Maximum | 3.2% | 3.4% |
| Range | 3.1% | 3.4% |
| Mean | 1.2% | 1.1% |
| Median | 1.2% | 1.0% |
| Interquartile 25% (IQ1) | 0.68% | 0.75% |
| Interquartile 75% (IQ3) | 1.6% | 1.4% |
| Interquartile Range (IQR) | 0.90% | 0.64% |
| Standard Deviation (Sample) | 0.61% | 0.63% |
| Standard Deviation (Population) | 0.61% | 0.63% |
Demographics Similar to Immigrants from St. Vincent and the Grenadines and Immigrants from Cuba by Doctorate Degree
In terms of doctorate degree, the demographic groups most similar to Immigrants from St. Vincent and the Grenadines are Dutch West Indian (1.3%, a difference of 0.11%), Seminole (1.3%, a difference of 0.16%), Immigrants from Belize (1.3%, a difference of 0.36%), Native/Alaskan (1.3%, a difference of 0.69%), and Pima (1.3%, a difference of 1.1%). Similarly, the demographic groups most similar to Immigrants from Cuba are Immigrants from Central America (1.2%, a difference of 0.81%), Puget Sound Salish (1.2%, a difference of 2.1%), Bangladeshi (1.2%, a difference of 2.9%), Nepalese (1.3%, a difference of 6.5%), and Immigrants from Haiti (1.3%, a difference of 6.8%).
| Demographics | Rating | Rank | Doctorate Degree |
| Immigrants | St. Vincent and the Grenadines | 0.1 /100 | #320 | Tragic 1.3% |
| Dutch West Indians | 0.1 /100 | #321 | Tragic 1.3% |
| Seminole | 0.1 /100 | #322 | Tragic 1.3% |
| Immigrants | Belize | 0.1 /100 | #323 | Tragic 1.3% |
| Natives/Alaskans | 0.0 /100 | #324 | Tragic 1.3% |
| Pima | 0.0 /100 | #325 | Tragic 1.3% |
| Immigrants | Cabo Verde | 0.0 /100 | #326 | Tragic 1.3% |
| Hispanics or Latinos | 0.0 /100 | #327 | Tragic 1.3% |
| Inupiat | 0.0 /100 | #328 | Tragic 1.3% |
| Haitians | 0.0 /100 | #329 | Tragic 1.3% |
| Yup'ik | 0.0 /100 | #330 | Tragic 1.3% |
| Immigrants | Latin America | 0.0 /100 | #331 | Tragic 1.3% |
| Yakama | 0.0 /100 | #332 | Tragic 1.3% |
| Immigrants | Caribbean | 0.0 /100 | #333 | Tragic 1.3% |
| Immigrants | Dominican Republic | 0.0 /100 | #334 | Tragic 1.3% |
| Immigrants | Haiti | 0.0 /100 | #335 | Tragic 1.3% |
| Nepalese | 0.0 /100 | #336 | Tragic 1.3% |
| Bangladeshis | 0.0 /100 | #337 | Tragic 1.2% |
| Puget Sound Salish | 0.0 /100 | #338 | Tragic 1.2% |
| Immigrants | Central America | 0.0 /100 | #339 | Tragic 1.2% |
| Immigrants | Cuba | 0.0 /100 | #340 | Tragic 1.2% |