Immigrants from Belize vs Immigrants from Cuba Doctorate Degree
COMPARE
Immigrants from Belize
Immigrants from Cuba
Doctorate Degree
Doctorate Degree Comparison
Immigrants from Belize
Immigrants from Cuba
1.3%
DOCTORATE DEGREE
0.1/ 100
METRIC RATING
323rd/ 347
METRIC RANK
1.2%
DOCTORATE DEGREE
0.0/ 100
METRIC RATING
340th/ 347
METRIC RANK
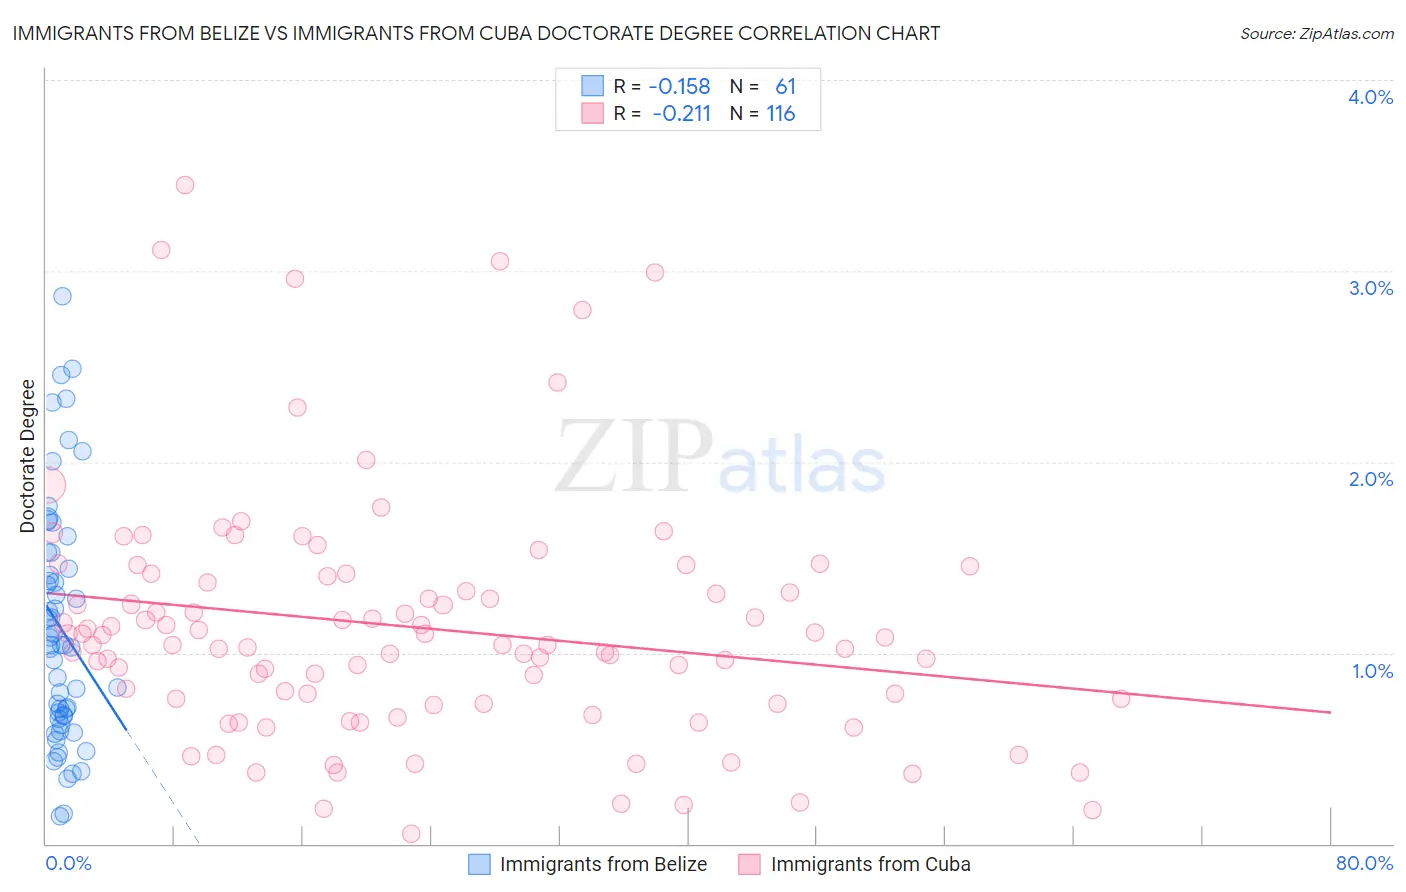
Immigrants from Belize vs Immigrants from Cuba Doctorate Degree Correlation Chart
The statistical analysis conducted on geographies consisting of 129,933,258 people shows a poor negative correlation between the proportion of Immigrants from Belize and percentage of population with at least doctorate degree education in the United States with a correlation coefficient (R) of -0.158 and weighted average of 1.3%. Similarly, the statistical analysis conducted on geographies consisting of 323,189,632 people shows a weak negative correlation between the proportion of Immigrants from Cuba and percentage of population with at least doctorate degree education in the United States with a correlation coefficient (R) of -0.211 and weighted average of 1.2%, a difference of 12.9%.
Doctorate Degree Correlation Summary
| Measurement | Immigrants from Belize | Immigrants from Cuba |
| Minimum | 0.14% | 0.055% |
| Maximum | 2.9% | 3.4% |
| Range | 2.7% | 3.4% |
| Mean | 1.1% | 1.1% |
| Median | 1.0% | 1.0% |
| Interquartile 25% (IQ1) | 0.66% | 0.75% |
| Interquartile 75% (IQ3) | 1.5% | 1.4% |
| Interquartile Range (IQR) | 0.82% | 0.64% |
| Standard Deviation (Sample) | 0.62% | 0.63% |
| Standard Deviation (Population) | 0.62% | 0.63% |
Demographics Similar to Immigrants from Belize and Immigrants from Cuba by Doctorate Degree
In terms of doctorate degree, the demographic groups most similar to Immigrants from Belize are Seminole (1.3%, a difference of 0.20%), Dutch West Indian (1.3%, a difference of 0.26%), Native/Alaskan (1.3%, a difference of 0.32%), Pima (1.3%, a difference of 0.72%), and Immigrants from Cabo Verde (1.3%, a difference of 0.74%). Similarly, the demographic groups most similar to Immigrants from Cuba are Mexican (1.2%, a difference of 0.48%), Immigrants from Central America (1.2%, a difference of 0.81%), Puget Sound Salish (1.2%, a difference of 2.1%), Bangladeshi (1.2%, a difference of 2.9%), and Nepalese (1.3%, a difference of 6.5%).
| Demographics | Rating | Rank | Doctorate Degree |
| Dutch West Indians | 0.1 /100 | #321 | Tragic 1.3% |
| Seminole | 0.1 /100 | #322 | Tragic 1.3% |
| Immigrants | Belize | 0.1 /100 | #323 | Tragic 1.3% |
| Natives/Alaskans | 0.0 /100 | #324 | Tragic 1.3% |
| Pima | 0.0 /100 | #325 | Tragic 1.3% |
| Immigrants | Cabo Verde | 0.0 /100 | #326 | Tragic 1.3% |
| Hispanics or Latinos | 0.0 /100 | #327 | Tragic 1.3% |
| Inupiat | 0.0 /100 | #328 | Tragic 1.3% |
| Haitians | 0.0 /100 | #329 | Tragic 1.3% |
| Yup'ik | 0.0 /100 | #330 | Tragic 1.3% |
| Immigrants | Latin America | 0.0 /100 | #331 | Tragic 1.3% |
| Yakama | 0.0 /100 | #332 | Tragic 1.3% |
| Immigrants | Caribbean | 0.0 /100 | #333 | Tragic 1.3% |
| Immigrants | Dominican Republic | 0.0 /100 | #334 | Tragic 1.3% |
| Immigrants | Haiti | 0.0 /100 | #335 | Tragic 1.3% |
| Nepalese | 0.0 /100 | #336 | Tragic 1.3% |
| Bangladeshis | 0.0 /100 | #337 | Tragic 1.2% |
| Puget Sound Salish | 0.0 /100 | #338 | Tragic 1.2% |
| Immigrants | Central America | 0.0 /100 | #339 | Tragic 1.2% |
| Immigrants | Cuba | 0.0 /100 | #340 | Tragic 1.2% |
| Mexicans | 0.0 /100 | #341 | Tragic 1.2% |