Vietnamese vs Immigrants from Chile Doctorate Degree
COMPARE
Vietnamese
Immigrants from Chile
Doctorate Degree
Doctorate Degree Comparison
Vietnamese
Immigrants from Chile
1.9%
DOCTORATE DEGREE
54.8/ 100
METRIC RATING
169th/ 347
METRIC RANK
2.1%
DOCTORATE DEGREE
98.1/ 100
METRIC RATING
102nd/ 347
METRIC RANK
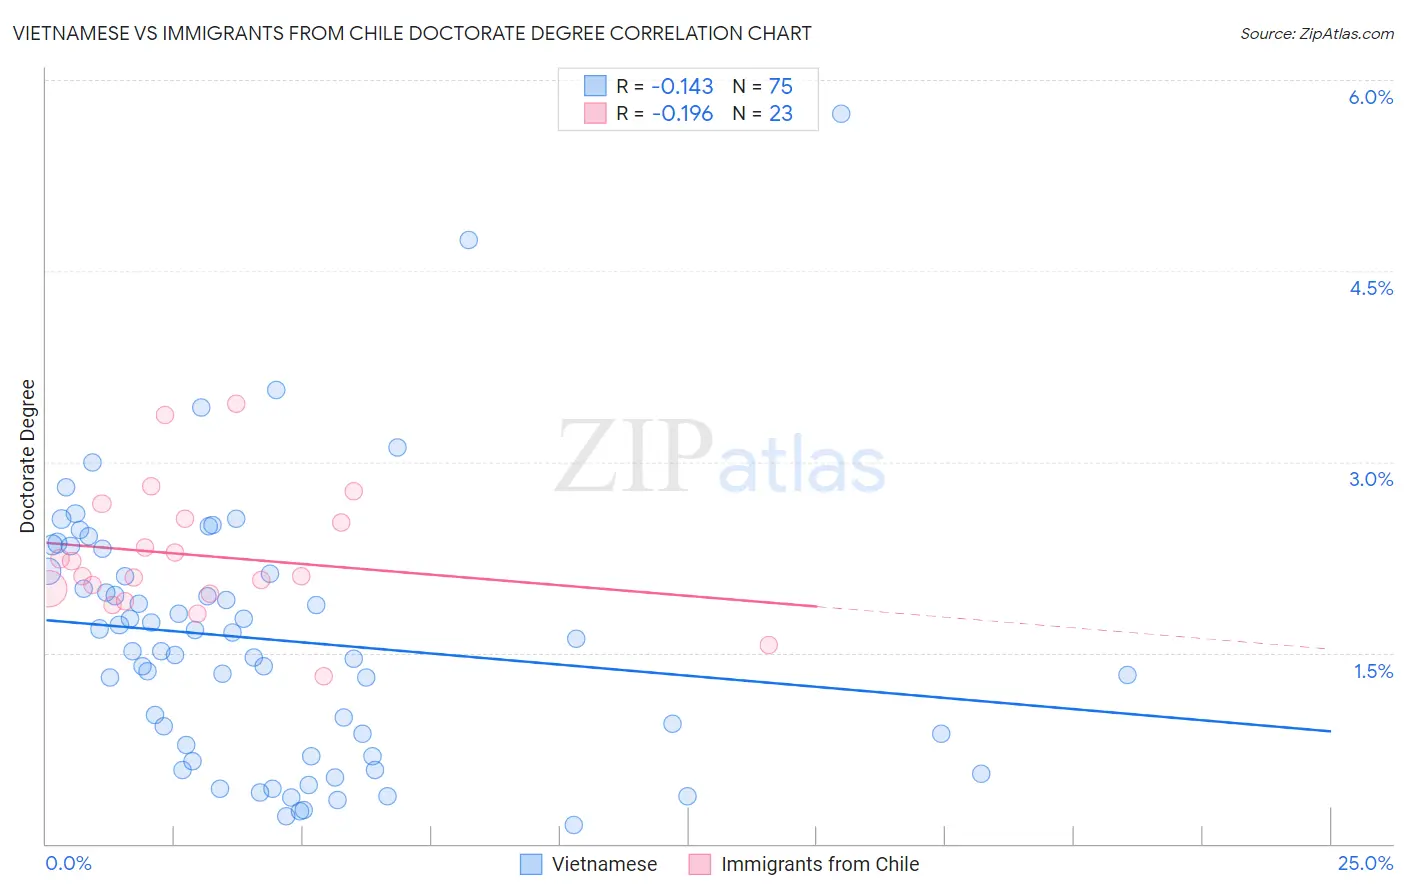
Vietnamese vs Immigrants from Chile Doctorate Degree Correlation Chart
The statistical analysis conducted on geographies consisting of 170,365,773 people shows a poor negative correlation between the proportion of Vietnamese and percentage of population with at least doctorate degree education in the United States with a correlation coefficient (R) of -0.143 and weighted average of 1.9%. Similarly, the statistical analysis conducted on geographies consisting of 217,998,165 people shows a poor negative correlation between the proportion of Immigrants from Chile and percentage of population with at least doctorate degree education in the United States with a correlation coefficient (R) of -0.196 and weighted average of 2.1%, a difference of 13.7%.
Doctorate Degree Correlation Summary
| Measurement | Vietnamese | Immigrants from Chile |
| Minimum | 0.14% | 1.3% |
| Maximum | 5.7% | 3.5% |
| Range | 5.6% | 2.1% |
| Mean | 1.6% | 2.3% |
| Median | 1.5% | 2.1% |
| Interquartile 25% (IQ1) | 0.69% | 2.0% |
| Interquartile 75% (IQ3) | 2.1% | 2.5% |
| Interquartile Range (IQR) | 1.4% | 0.58% |
| Standard Deviation (Sample) | 1.0% | 0.51% |
| Standard Deviation (Population) | 1.0% | 0.50% |
Similar Demographics by Doctorate Degree
Demographics Similar to Vietnamese by Doctorate Degree
In terms of doctorate degree, the demographic groups most similar to Vietnamese are Costa Rican (1.8%, a difference of 0.22%), Bermudan (1.8%, a difference of 0.39%), Belgian (1.8%, a difference of 0.66%), Norwegian (1.8%, a difference of 0.70%), and Immigrants from Bangladesh (1.8%, a difference of 0.70%).
| Demographics | Rating | Rank | Doctorate Degree |
| Irish | 67.5 /100 | #162 | Good 1.9% |
| Czechs | 67.3 /100 | #163 | Good 1.9% |
| Celtics | 66.7 /100 | #164 | Good 1.9% |
| Scotch-Irish | 63.6 /100 | #165 | Good 1.9% |
| Spaniards | 63.5 /100 | #166 | Good 1.9% |
| Macedonians | 60.9 /100 | #167 | Good 1.9% |
| Sri Lankans | 60.3 /100 | #168 | Good 1.9% |
| Vietnamese | 54.8 /100 | #169 | Average 1.9% |
| Costa Ricans | 53.3 /100 | #170 | Average 1.8% |
| Bermudans | 52.1 /100 | #171 | Average 1.8% |
| Belgians | 50.3 /100 | #172 | Average 1.8% |
| Norwegians | 50.0 /100 | #173 | Average 1.8% |
| Immigrants | Bangladesh | 50.0 /100 | #174 | Average 1.8% |
| Immigrants | Thailand | 49.4 /100 | #175 | Average 1.8% |
| Spanish | 49.3 /100 | #176 | Average 1.8% |
Demographics Similar to Immigrants from Chile by Doctorate Degree
In terms of doctorate degree, the demographic groups most similar to Immigrants from Chile are Romanian (2.1%, a difference of 0.010%), Austrian (2.1%, a difference of 0.13%), Immigrants from Eastern Africa (2.1%, a difference of 0.22%), Immigrants from Egypt (2.1%, a difference of 0.25%), and Immigrants from Eastern Europe (2.1%, a difference of 0.25%).
| Demographics | Rating | Rank | Doctorate Degree |
| Immigrants | Romania | 98.7 /100 | #95 | Exceptional 2.1% |
| Immigrants | Northern Africa | 98.4 /100 | #96 | Exceptional 2.1% |
| Immigrants | Eritrea | 98.4 /100 | #97 | Exceptional 2.1% |
| Armenians | 98.3 /100 | #98 | Exceptional 2.1% |
| Immigrants | Egypt | 98.2 /100 | #99 | Exceptional 2.1% |
| Immigrants | Eastern Europe | 98.2 /100 | #100 | Exceptional 2.1% |
| Immigrants | Eastern Africa | 98.2 /100 | #101 | Exceptional 2.1% |
| Immigrants | Chile | 98.1 /100 | #102 | Exceptional 2.1% |
| Romanians | 98.1 /100 | #103 | Exceptional 2.1% |
| Austrians | 98.0 /100 | #104 | Exceptional 2.1% |
| Arabs | 97.8 /100 | #105 | Exceptional 2.1% |
| Sudanese | 97.7 /100 | #106 | Exceptional 2.1% |
| Europeans | 97.5 /100 | #107 | Exceptional 2.1% |
| Immigrants | Germany | 97.3 /100 | #108 | Exceptional 2.1% |
| Ukrainians | 97.2 /100 | #109 | Exceptional 2.1% |