Vietnamese vs Immigrants from Cuba Master's Degree
COMPARE
Vietnamese
Immigrants from Cuba
Master's Degree
Master's Degree Comparison
Vietnamese
Immigrants from Cuba
15.8%
MASTER'S DEGREE
85.5/ 100
METRIC RATING
140th/ 347
METRIC RANK
10.9%
MASTER'S DEGREE
0.0/ 100
METRIC RATING
318th/ 347
METRIC RANK
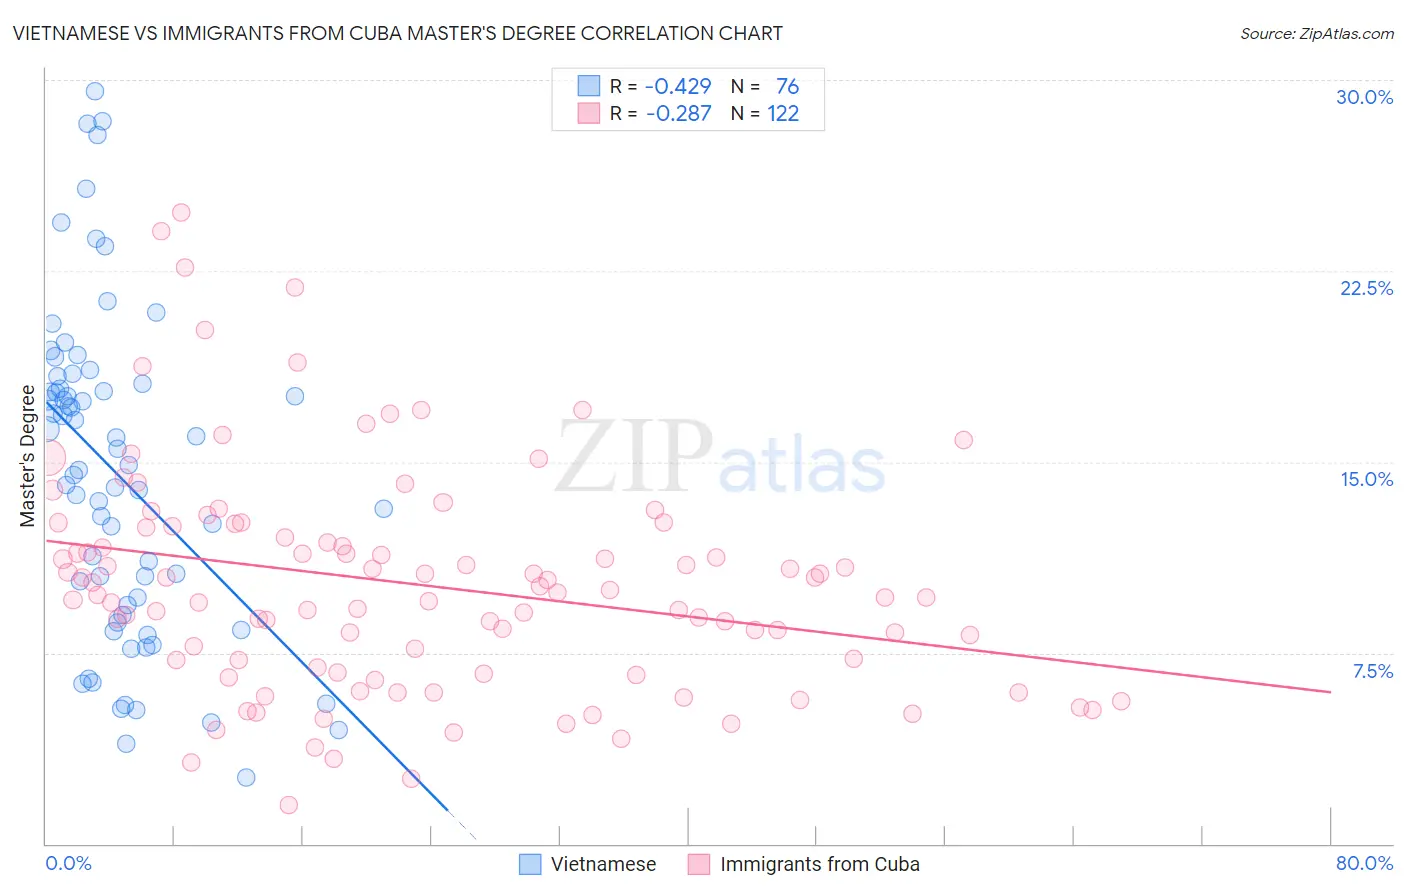
Vietnamese vs Immigrants from Cuba Master's Degree Correlation Chart
The statistical analysis conducted on geographies consisting of 170,730,532 people shows a moderate negative correlation between the proportion of Vietnamese and percentage of population with at least master's degree education in the United States with a correlation coefficient (R) of -0.429 and weighted average of 15.8%. Similarly, the statistical analysis conducted on geographies consisting of 325,858,973 people shows a weak negative correlation between the proportion of Immigrants from Cuba and percentage of population with at least master's degree education in the United States with a correlation coefficient (R) of -0.287 and weighted average of 10.9%, a difference of 45.3%.
Master's Degree Correlation Summary
| Measurement | Vietnamese | Immigrants from Cuba |
| Minimum | 2.6% | 1.5% |
| Maximum | 29.5% | 24.8% |
| Range | 26.9% | 23.3% |
| Mean | 14.5% | 10.2% |
| Median | 14.8% | 9.8% |
| Interquartile 25% (IQ1) | 9.2% | 6.9% |
| Interquartile 75% (IQ3) | 18.0% | 12.4% |
| Interquartile Range (IQR) | 8.8% | 5.5% |
| Standard Deviation (Sample) | 6.4% | 4.4% |
| Standard Deviation (Population) | 6.3% | 4.4% |
Similar Demographics by Master's Degree
Demographics Similar to Vietnamese by Master's Degree
In terms of master's degree, the demographic groups most similar to Vietnamese are Immigrants from Germany (15.8%, a difference of 0.090%), Polish (15.7%, a difference of 0.12%), Pakistani (15.8%, a difference of 0.14%), European (15.8%, a difference of 0.22%), and Assyrian/Chaldean/Syriac (15.8%, a difference of 0.33%).
| Demographics | Rating | Rank | Master's Degree |
| Immigrants | Sudan | 90.2 /100 | #133 | Exceptional 16.0% |
| Venezuelans | 88.4 /100 | #134 | Excellent 15.9% |
| South American Indians | 88.4 /100 | #135 | Excellent 15.9% |
| Assyrians/Chaldeans/Syriacs | 86.8 /100 | #136 | Excellent 15.8% |
| Europeans | 86.4 /100 | #137 | Excellent 15.8% |
| Pakistanis | 86.1 /100 | #138 | Excellent 15.8% |
| Immigrants | Germany | 85.9 /100 | #139 | Excellent 15.8% |
| Vietnamese | 85.5 /100 | #140 | Excellent 15.8% |
| Poles | 85.0 /100 | #141 | Excellent 15.7% |
| Immigrants | Africa | 84.0 /100 | #142 | Excellent 15.7% |
| Immigrants | Venezuela | 83.6 /100 | #143 | Excellent 15.7% |
| Canadians | 83.3 /100 | #144 | Excellent 15.7% |
| South Americans | 81.3 /100 | #145 | Excellent 15.6% |
| Immigrants | Afghanistan | 79.4 /100 | #146 | Good 15.6% |
| Hungarians | 79.1 /100 | #147 | Good 15.6% |
Demographics Similar to Immigrants from Cuba by Master's Degree
In terms of master's degree, the demographic groups most similar to Immigrants from Cuba are Hopi (10.9%, a difference of 0.13%), Kiowa (10.8%, a difference of 0.24%), Hispanic or Latino (10.9%, a difference of 0.67%), Immigrants from Micronesia (10.8%, a difference of 0.86%), and Cajun (11.0%, a difference of 1.0%).
| Demographics | Rating | Rank | Master's Degree |
| Seminole | 0.0 /100 | #311 | Tragic 11.0% |
| Choctaw | 0.0 /100 | #312 | Tragic 11.0% |
| Yaqui | 0.0 /100 | #313 | Tragic 11.0% |
| Cajuns | 0.0 /100 | #314 | Tragic 11.0% |
| Apache | 0.0 /100 | #315 | Tragic 11.0% |
| Hispanics or Latinos | 0.0 /100 | #316 | Tragic 10.9% |
| Hopi | 0.0 /100 | #317 | Tragic 10.9% |
| Immigrants | Cuba | 0.0 /100 | #318 | Tragic 10.9% |
| Kiowa | 0.0 /100 | #319 | Tragic 10.8% |
| Immigrants | Micronesia | 0.0 /100 | #320 | Tragic 10.8% |
| Pennsylvania Germans | 0.0 /100 | #321 | Tragic 10.7% |
| Sioux | 0.0 /100 | #322 | Tragic 10.7% |
| Crow | 0.0 /100 | #323 | Tragic 10.6% |
| Dutch West Indians | 0.0 /100 | #324 | Tragic 10.6% |
| Inupiat | 0.0 /100 | #325 | Tragic 10.5% |