Scandinavian vs Immigrants from Cuba Doctorate Degree
COMPARE
Scandinavian
Immigrants from Cuba
Doctorate Degree
Doctorate Degree Comparison
Scandinavians
Immigrants from Cuba
1.8%
DOCTORATE DEGREE
48.0/ 100
METRIC RATING
180th/ 347
METRIC RANK
1.2%
DOCTORATE DEGREE
0.0/ 100
METRIC RATING
340th/ 347
METRIC RANK
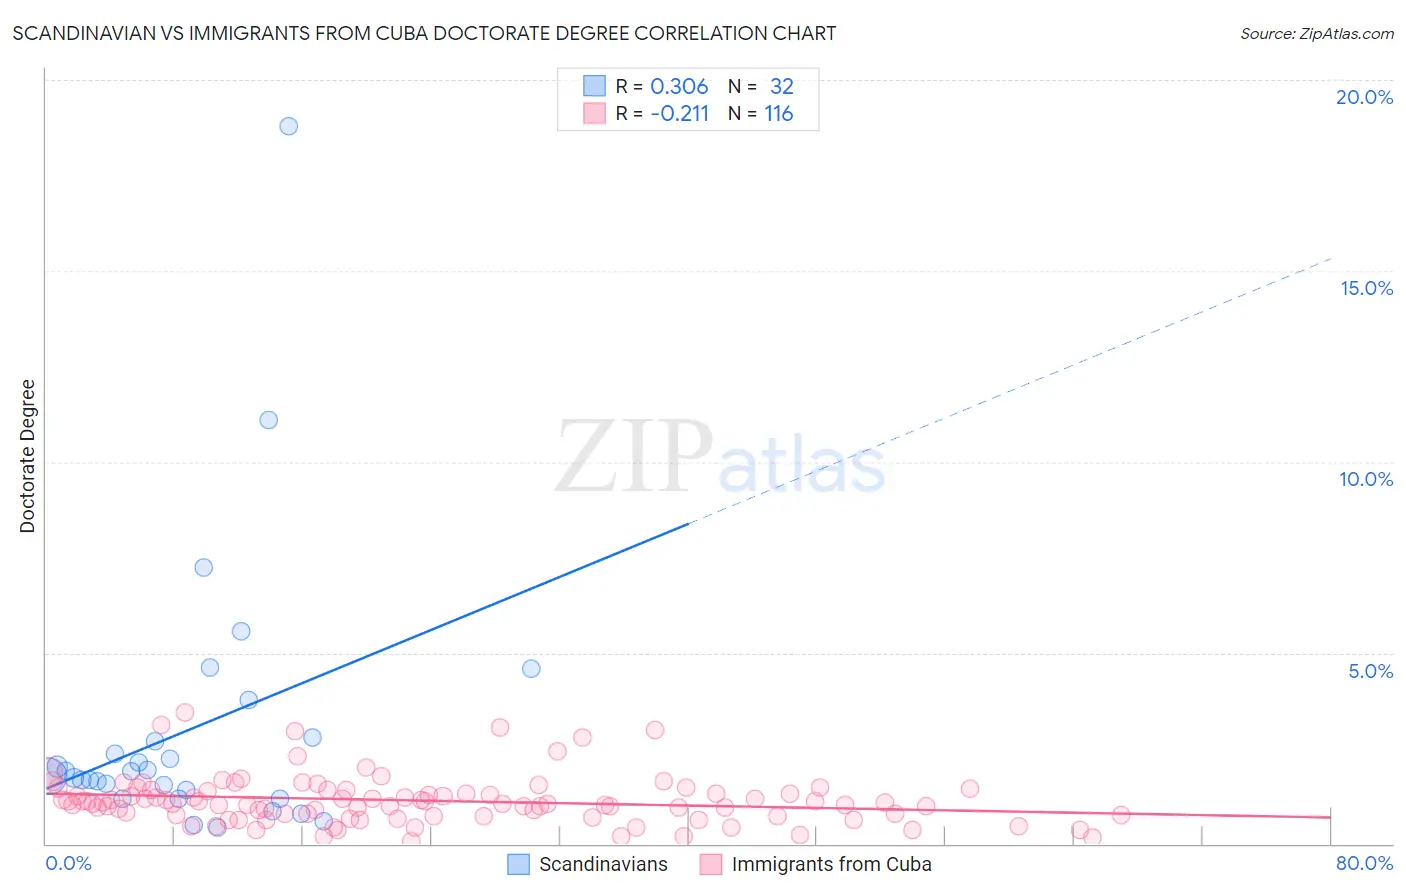
Scandinavian vs Immigrants from Cuba Doctorate Degree Correlation Chart
The statistical analysis conducted on geographies consisting of 462,476,987 people shows a mild positive correlation between the proportion of Scandinavians and percentage of population with at least doctorate degree education in the United States with a correlation coefficient (R) of 0.306 and weighted average of 1.8%. Similarly, the statistical analysis conducted on geographies consisting of 323,189,632 people shows a weak negative correlation between the proportion of Immigrants from Cuba and percentage of population with at least doctorate degree education in the United States with a correlation coefficient (R) of -0.211 and weighted average of 1.2%, a difference of 55.8%.
Doctorate Degree Correlation Summary
| Measurement | Scandinavian | Immigrants from Cuba |
| Minimum | 0.41% | 0.055% |
| Maximum | 18.8% | 3.4% |
| Range | 18.4% | 3.4% |
| Mean | 3.0% | 1.1% |
| Median | 1.8% | 1.0% |
| Interquartile 25% (IQ1) | 1.3% | 0.75% |
| Interquartile 75% (IQ3) | 2.7% | 1.4% |
| Interquartile Range (IQR) | 1.4% | 0.64% |
| Standard Deviation (Sample) | 3.6% | 0.63% |
| Standard Deviation (Population) | 3.6% | 0.63% |
Similar Demographics by Doctorate Degree
Demographics Similar to Scandinavians by Doctorate Degree
In terms of doctorate degree, the demographic groups most similar to Scandinavians are Ghanaian (1.8%, a difference of 0.050%), French (1.8%, a difference of 0.12%), Iraqi (1.8%, a difference of 0.18%), Spanish (1.8%, a difference of 0.19%), and Immigrants from Thailand (1.8%, a difference of 0.21%).
| Demographics | Rating | Rank | Doctorate Degree |
| Norwegians | 50.0 /100 | #173 | Average 1.8% |
| Immigrants | Bangladesh | 50.0 /100 | #174 | Average 1.8% |
| Immigrants | Thailand | 49.4 /100 | #175 | Average 1.8% |
| Spanish | 49.3 /100 | #176 | Average 1.8% |
| Iraqis | 49.2 /100 | #177 | Average 1.8% |
| French | 48.8 /100 | #178 | Average 1.8% |
| Ghanaians | 48.3 /100 | #179 | Average 1.8% |
| Scandinavians | 48.0 /100 | #180 | Average 1.8% |
| Immigrants | Immigrants | 46.2 /100 | #181 | Average 1.8% |
| Immigrants | Afghanistan | 44.3 /100 | #182 | Average 1.8% |
| Finns | 42.1 /100 | #183 | Average 1.8% |
| Nigerians | 39.9 /100 | #184 | Fair 1.8% |
| Slovaks | 36.4 /100 | #185 | Fair 1.8% |
| Peruvians | 34.4 /100 | #186 | Fair 1.8% |
| Czechoslovakians | 33.0 /100 | #187 | Fair 1.8% |
Demographics Similar to Immigrants from Cuba by Doctorate Degree
In terms of doctorate degree, the demographic groups most similar to Immigrants from Cuba are Mexican (1.2%, a difference of 0.48%), Immigrants from Central America (1.2%, a difference of 0.81%), Arapaho (1.2%, a difference of 0.86%), Puget Sound Salish (1.2%, a difference of 2.1%), and Bangladeshi (1.2%, a difference of 2.9%).
| Demographics | Rating | Rank | Doctorate Degree |
| Immigrants | Caribbean | 0.0 /100 | #333 | Tragic 1.3% |
| Immigrants | Dominican Republic | 0.0 /100 | #334 | Tragic 1.3% |
| Immigrants | Haiti | 0.0 /100 | #335 | Tragic 1.3% |
| Nepalese | 0.0 /100 | #336 | Tragic 1.3% |
| Bangladeshis | 0.0 /100 | #337 | Tragic 1.2% |
| Puget Sound Salish | 0.0 /100 | #338 | Tragic 1.2% |
| Immigrants | Central America | 0.0 /100 | #339 | Tragic 1.2% |
| Immigrants | Cuba | 0.0 /100 | #340 | Tragic 1.2% |
| Mexicans | 0.0 /100 | #341 | Tragic 1.2% |
| Arapaho | 0.0 /100 | #342 | Tragic 1.2% |
| Fijians | 0.0 /100 | #343 | Tragic 1.1% |
| Immigrants | Mexico | 0.0 /100 | #344 | Tragic 1.1% |
| Lumbee | 0.0 /100 | #345 | Tragic 1.1% |
| Spanish American Indians | 0.0 /100 | #346 | Tragic 1.1% |
| Houma | 0.0 /100 | #347 | Tragic 0.96% |