Vietnamese vs Italian Doctorate Degree
COMPARE
Vietnamese
Italian
Doctorate Degree
Doctorate Degree Comparison
Vietnamese
Italians
1.9%
DOCTORATE DEGREE
54.8/ 100
METRIC RATING
169th/ 347
METRIC RANK
2.0%
DOCTORATE DEGREE
86.0/ 100
METRIC RATING
142nd/ 347
METRIC RANK
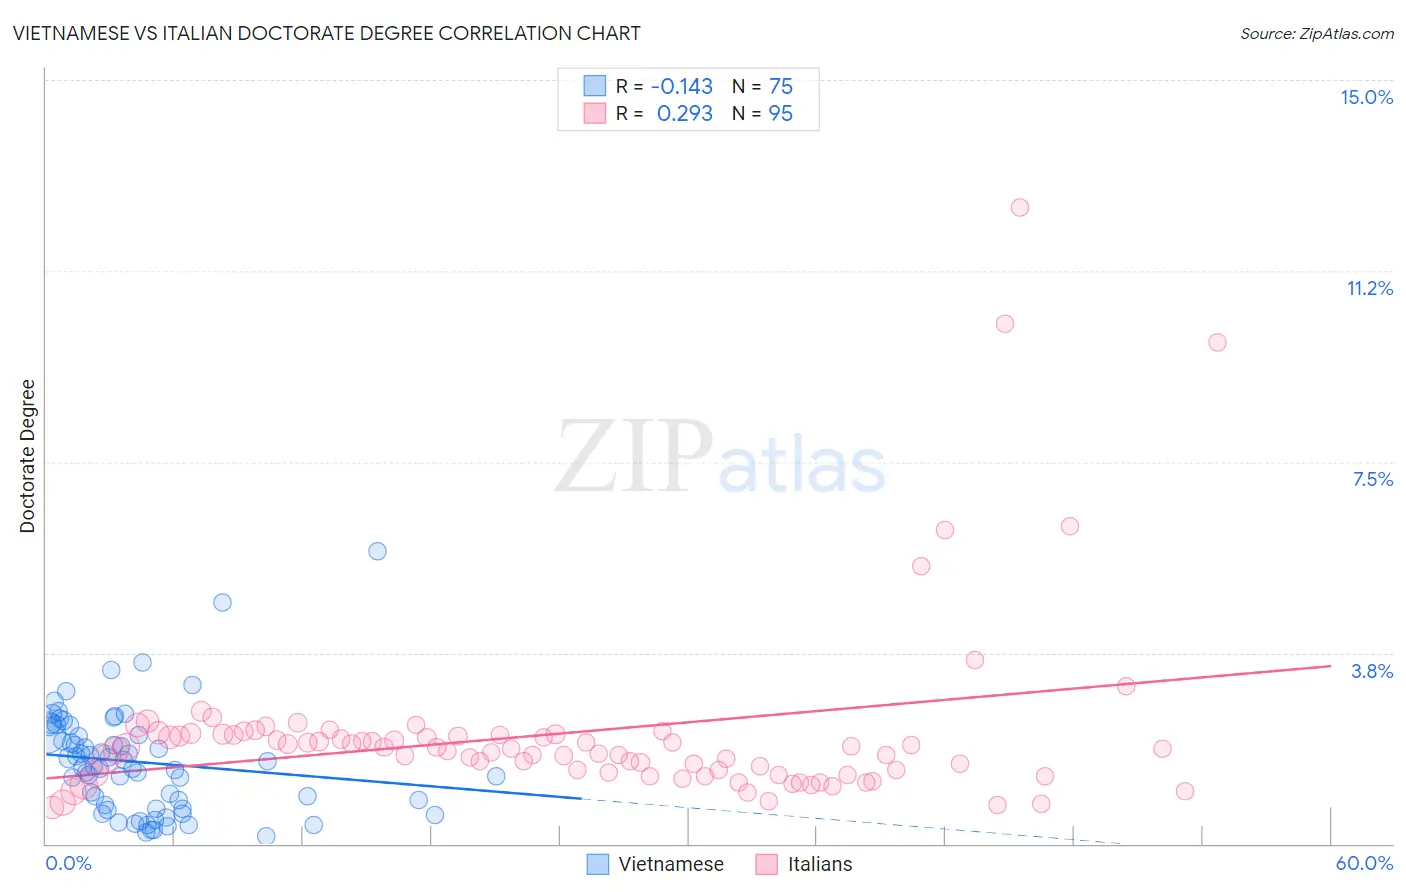
Vietnamese vs Italian Doctorate Degree Correlation Chart
The statistical analysis conducted on geographies consisting of 170,365,773 people shows a poor negative correlation between the proportion of Vietnamese and percentage of population with at least doctorate degree education in the United States with a correlation coefficient (R) of -0.143 and weighted average of 1.9%. Similarly, the statistical analysis conducted on geographies consisting of 549,362,939 people shows a weak positive correlation between the proportion of Italians and percentage of population with at least doctorate degree education in the United States with a correlation coefficient (R) of 0.293 and weighted average of 2.0%, a difference of 5.9%.
Doctorate Degree Correlation Summary
| Measurement | Vietnamese | Italian |
| Minimum | 0.14% | 0.72% |
| Maximum | 5.7% | 12.5% |
| Range | 5.6% | 11.8% |
| Mean | 1.6% | 2.2% |
| Median | 1.5% | 1.9% |
| Interquartile 25% (IQ1) | 0.69% | 1.4% |
| Interquartile 75% (IQ3) | 2.1% | 2.1% |
| Interquartile Range (IQR) | 1.4% | 0.77% |
| Standard Deviation (Sample) | 1.0% | 1.8% |
| Standard Deviation (Population) | 1.0% | 1.8% |
Similar Demographics by Doctorate Degree
Demographics Similar to Vietnamese by Doctorate Degree
In terms of doctorate degree, the demographic groups most similar to Vietnamese are Costa Rican (1.8%, a difference of 0.22%), Bermudan (1.8%, a difference of 0.39%), Belgian (1.8%, a difference of 0.66%), Norwegian (1.8%, a difference of 0.70%), and Immigrants from Bangladesh (1.8%, a difference of 0.70%).
| Demographics | Rating | Rank | Doctorate Degree |
| Irish | 67.5 /100 | #162 | Good 1.9% |
| Czechs | 67.3 /100 | #163 | Good 1.9% |
| Celtics | 66.7 /100 | #164 | Good 1.9% |
| Scotch-Irish | 63.6 /100 | #165 | Good 1.9% |
| Spaniards | 63.5 /100 | #166 | Good 1.9% |
| Macedonians | 60.9 /100 | #167 | Good 1.9% |
| Sri Lankans | 60.3 /100 | #168 | Good 1.9% |
| Vietnamese | 54.8 /100 | #169 | Average 1.9% |
| Costa Ricans | 53.3 /100 | #170 | Average 1.8% |
| Bermudans | 52.1 /100 | #171 | Average 1.8% |
| Belgians | 50.3 /100 | #172 | Average 1.8% |
| Norwegians | 50.0 /100 | #173 | Average 1.8% |
| Immigrants | Bangladesh | 50.0 /100 | #174 | Average 1.8% |
| Immigrants | Thailand | 49.4 /100 | #175 | Average 1.8% |
| Spanish | 49.3 /100 | #176 | Average 1.8% |
Demographics Similar to Italians by Doctorate Degree
In terms of doctorate degree, the demographic groups most similar to Italians are Senegalese (2.0%, a difference of 0.21%), Sierra Leonean (2.0%, a difference of 0.25%), Immigrants from Africa (2.0%, a difference of 0.28%), Afghan (2.0%, a difference of 0.36%), and Immigrants from Moldova (2.0%, a difference of 0.46%).
| Demographics | Rating | Rank | Doctorate Degree |
| Serbians | 88.7 /100 | #135 | Excellent 2.0% |
| Swedes | 88.3 /100 | #136 | Excellent 2.0% |
| South American Indians | 88.3 /100 | #137 | Excellent 2.0% |
| Swiss | 88.0 /100 | #138 | Excellent 2.0% |
| Afghans | 87.2 /100 | #139 | Excellent 2.0% |
| Immigrants | Africa | 87.0 /100 | #140 | Excellent 2.0% |
| Senegalese | 86.7 /100 | #141 | Excellent 2.0% |
| Italians | 86.0 /100 | #142 | Excellent 2.0% |
| Sierra Leoneans | 85.1 /100 | #143 | Excellent 2.0% |
| Immigrants | Moldova | 84.3 /100 | #144 | Excellent 2.0% |
| Kenyans | 83.6 /100 | #145 | Excellent 1.9% |
| Immigrants | Syria | 83.6 /100 | #146 | Excellent 1.9% |
| Immigrants | Senegal | 82.5 /100 | #147 | Excellent 1.9% |
| Luxembourgers | 81.1 /100 | #148 | Excellent 1.9% |
| Basques | 76.9 /100 | #149 | Good 1.9% |