Maltese vs Immigrants from Cuba Doctorate Degree
COMPARE
Maltese
Immigrants from Cuba
Doctorate Degree
Doctorate Degree Comparison
Maltese
Immigrants from Cuba
2.1%
DOCTORATE DEGREE
96.2/ 100
METRIC RATING
116th/ 347
METRIC RANK
1.2%
DOCTORATE DEGREE
0.0/ 100
METRIC RATING
340th/ 347
METRIC RANK
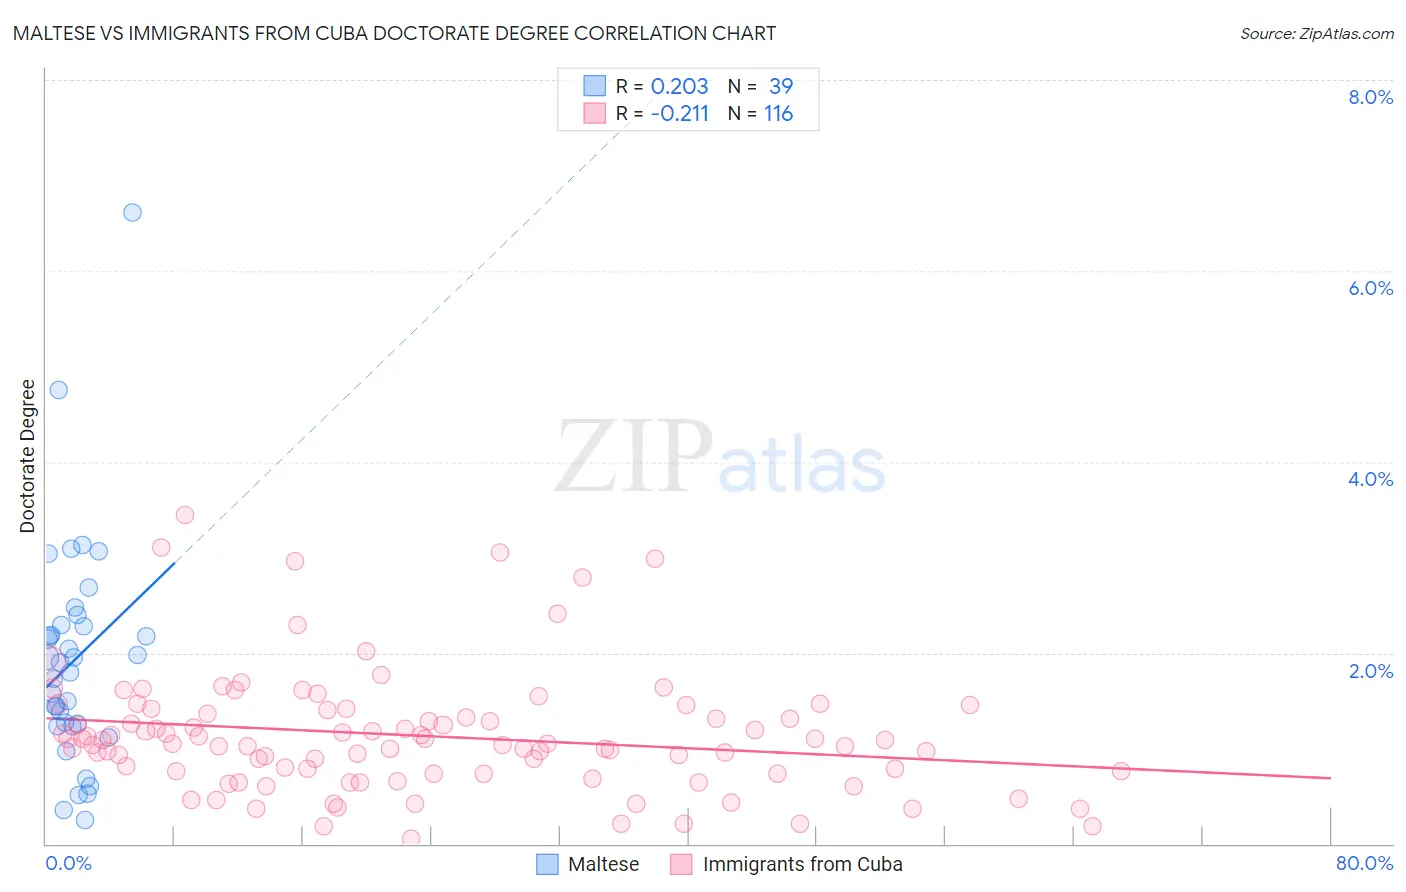
Maltese vs Immigrants from Cuba Doctorate Degree Correlation Chart
The statistical analysis conducted on geographies consisting of 126,152,817 people shows a weak positive correlation between the proportion of Maltese and percentage of population with at least doctorate degree education in the United States with a correlation coefficient (R) of 0.203 and weighted average of 2.1%. Similarly, the statistical analysis conducted on geographies consisting of 323,189,632 people shows a weak negative correlation between the proportion of Immigrants from Cuba and percentage of population with at least doctorate degree education in the United States with a correlation coefficient (R) of -0.211 and weighted average of 1.2%, a difference of 74.8%.
Doctorate Degree Correlation Summary
| Measurement | Maltese | Immigrants from Cuba |
| Minimum | 0.25% | 0.055% |
| Maximum | 6.6% | 3.4% |
| Range | 6.4% | 3.4% |
| Mean | 1.9% | 1.1% |
| Median | 1.9% | 1.0% |
| Interquartile 25% (IQ1) | 1.2% | 0.75% |
| Interquartile 75% (IQ3) | 2.3% | 1.4% |
| Interquartile Range (IQR) | 1.1% | 0.64% |
| Standard Deviation (Sample) | 1.2% | 0.63% |
| Standard Deviation (Population) | 1.2% | 0.63% |
Similar Demographics by Doctorate Degree
Demographics Similar to Maltese by Doctorate Degree
In terms of doctorate degree, the demographic groups most similar to Maltese are Lebanese (2.1%, a difference of 0.17%), Icelander (2.1%, a difference of 0.21%), Pakistani (2.0%, a difference of 0.34%), Taiwanese (2.1%, a difference of 0.46%), and Immigrants from Croatia (2.1%, a difference of 0.54%).
| Demographics | Rating | Rank | Doctorate Degree |
| Ukrainians | 97.2 /100 | #109 | Exceptional 2.1% |
| Brazilians | 97.2 /100 | #110 | Exceptional 2.1% |
| Immigrants | Pakistan | 97.1 /100 | #111 | Exceptional 2.1% |
| Syrians | 97.1 /100 | #112 | Exceptional 2.1% |
| Immigrants | Italy | 96.9 /100 | #113 | Exceptional 2.1% |
| Immigrants | Croatia | 96.8 /100 | #114 | Exceptional 2.1% |
| Taiwanese | 96.7 /100 | #115 | Exceptional 2.1% |
| Maltese | 96.2 /100 | #116 | Exceptional 2.1% |
| Lebanese | 96.0 /100 | #117 | Exceptional 2.1% |
| Icelanders | 96.0 /100 | #118 | Exceptional 2.1% |
| Pakistanis | 95.8 /100 | #119 | Exceptional 2.0% |
| Immigrants | Morocco | 95.5 /100 | #120 | Exceptional 2.0% |
| Immigrants | Jordan | 94.8 /100 | #121 | Exceptional 2.0% |
| Immigrants | Southern Europe | 94.7 /100 | #122 | Exceptional 2.0% |
| Croatians | 94.0 /100 | #123 | Exceptional 2.0% |
Demographics Similar to Immigrants from Cuba by Doctorate Degree
In terms of doctorate degree, the demographic groups most similar to Immigrants from Cuba are Mexican (1.2%, a difference of 0.48%), Immigrants from Central America (1.2%, a difference of 0.81%), Arapaho (1.2%, a difference of 0.86%), Puget Sound Salish (1.2%, a difference of 2.1%), and Bangladeshi (1.2%, a difference of 2.9%).
| Demographics | Rating | Rank | Doctorate Degree |
| Immigrants | Caribbean | 0.0 /100 | #333 | Tragic 1.3% |
| Immigrants | Dominican Republic | 0.0 /100 | #334 | Tragic 1.3% |
| Immigrants | Haiti | 0.0 /100 | #335 | Tragic 1.3% |
| Nepalese | 0.0 /100 | #336 | Tragic 1.3% |
| Bangladeshis | 0.0 /100 | #337 | Tragic 1.2% |
| Puget Sound Salish | 0.0 /100 | #338 | Tragic 1.2% |
| Immigrants | Central America | 0.0 /100 | #339 | Tragic 1.2% |
| Immigrants | Cuba | 0.0 /100 | #340 | Tragic 1.2% |
| Mexicans | 0.0 /100 | #341 | Tragic 1.2% |
| Arapaho | 0.0 /100 | #342 | Tragic 1.2% |
| Fijians | 0.0 /100 | #343 | Tragic 1.1% |
| Immigrants | Mexico | 0.0 /100 | #344 | Tragic 1.1% |
| Lumbee | 0.0 /100 | #345 | Tragic 1.1% |
| Spanish American Indians | 0.0 /100 | #346 | Tragic 1.1% |
| Houma | 0.0 /100 | #347 | Tragic 0.96% |