U.S. Virgin Islander vs Paraguayan College, 1 year or more
COMPARE
U.S. Virgin Islander
Paraguayan
College, 1 year or more
College, 1 year or more Comparison
U.S. Virgin Islanders
Paraguayans
54.8%
COLLEGE, 1 YEAR OR MORE
0.3/ 100
METRIC RATING
263rd/ 347
METRIC RANK
62.9%
COLLEGE, 1 YEAR OR MORE
98.8/ 100
METRIC RATING
76th/ 347
METRIC RANK
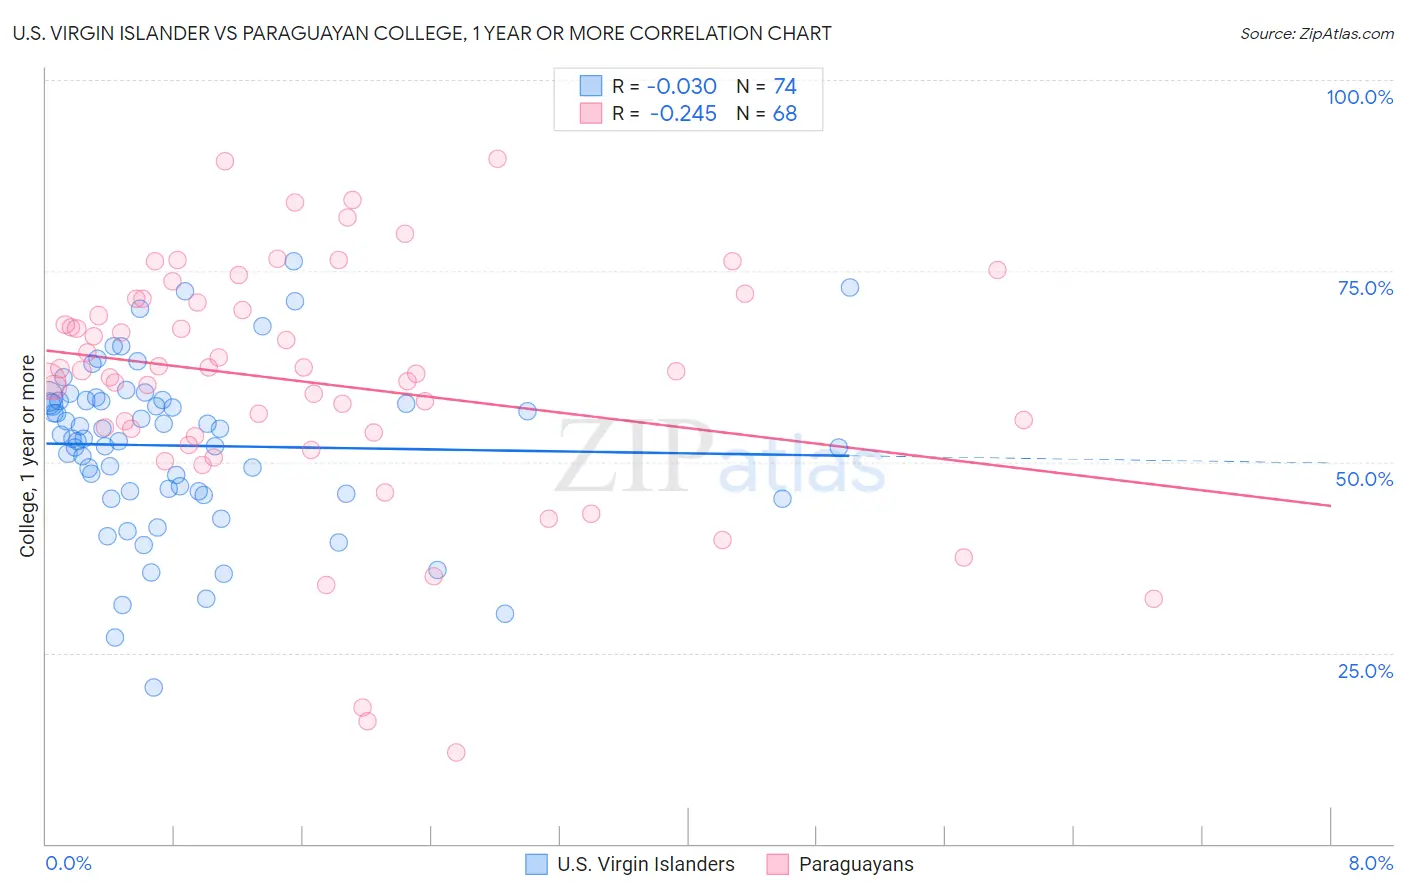
U.S. Virgin Islander vs Paraguayan College, 1 year or more Correlation Chart
The statistical analysis conducted on geographies consisting of 87,526,675 people shows no correlation between the proportion of U.S. Virgin Islanders and percentage of population with at least college, 1 year or more education in the United States with a correlation coefficient (R) of -0.030 and weighted average of 54.8%. Similarly, the statistical analysis conducted on geographies consisting of 95,113,072 people shows a weak negative correlation between the proportion of Paraguayans and percentage of population with at least college, 1 year or more education in the United States with a correlation coefficient (R) of -0.245 and weighted average of 62.9%, a difference of 14.8%.
College, 1 year or more Correlation Summary
| Measurement | U.S. Virgin Islander | Paraguayan |
| Minimum | 20.5% | 11.9% |
| Maximum | 76.2% | 89.8% |
| Range | 55.7% | 77.9% |
| Mean | 52.1% | 60.3% |
| Median | 53.3% | 61.9% |
| Interquartile 25% (IQ1) | 46.2% | 53.5% |
| Interquartile 75% (IQ3) | 58.0% | 71.1% |
| Interquartile Range (IQR) | 11.8% | 17.6% |
| Standard Deviation (Sample) | 10.9% | 16.1% |
| Standard Deviation (Population) | 10.8% | 16.0% |
Similar Demographics by College, 1 year or more
Demographics Similar to U.S. Virgin Islanders by College, 1 year or more
In terms of college, 1 year or more, the demographic groups most similar to U.S. Virgin Islanders are Immigrants from St. Vincent and the Grenadines (54.8%, a difference of 0.020%), Immigrants from Micronesia (54.8%, a difference of 0.020%), Ottawa (54.9%, a difference of 0.11%), Jamaican (54.9%, a difference of 0.13%), and Immigrants from Laos (54.7%, a difference of 0.22%).
| Demographics | Rating | Rank | College, 1 year or more |
| Immigrants | West Indies | 0.5 /100 | #256 | Tragic 55.2% |
| Indonesians | 0.4 /100 | #257 | Tragic 55.1% |
| Africans | 0.4 /100 | #258 | Tragic 55.0% |
| Nepalese | 0.3 /100 | #259 | Tragic 54.9% |
| Jamaicans | 0.3 /100 | #260 | Tragic 54.9% |
| Ottawa | 0.3 /100 | #261 | Tragic 54.9% |
| Immigrants | St. Vincent and the Grenadines | 0.3 /100 | #262 | Tragic 54.8% |
| U.S. Virgin Islanders | 0.3 /100 | #263 | Tragic 54.8% |
| Immigrants | Micronesia | 0.3 /100 | #264 | Tragic 54.8% |
| Immigrants | Laos | 0.2 /100 | #265 | Tragic 54.7% |
| Potawatomi | 0.2 /100 | #266 | Tragic 54.6% |
| Blackfeet | 0.2 /100 | #267 | Tragic 54.6% |
| British West Indians | 0.2 /100 | #268 | Tragic 54.5% |
| Bangladeshis | 0.2 /100 | #269 | Tragic 54.5% |
| Crow | 0.2 /100 | #270 | Tragic 54.5% |
Demographics Similar to Paraguayans by College, 1 year or more
In terms of college, 1 year or more, the demographic groups most similar to Paraguayans are Ethiopian (62.9%, a difference of 0.0%), Immigrants from Lebanon (62.9%, a difference of 0.020%), Northern European (62.9%, a difference of 0.030%), Lithuanian (62.9%, a difference of 0.070%), and Armenian (63.0%, a difference of 0.10%).
| Demographics | Rating | Rank | College, 1 year or more |
| Immigrants | Zimbabwe | 99.3 /100 | #69 | Exceptional 63.3% |
| Argentineans | 99.2 /100 | #70 | Exceptional 63.2% |
| Immigrants | Canada | 99.1 /100 | #71 | Exceptional 63.1% |
| Egyptians | 99.0 /100 | #72 | Exceptional 63.1% |
| Immigrants | Moldova | 99.0 /100 | #73 | Exceptional 63.0% |
| Immigrants | North America | 99.0 /100 | #74 | Exceptional 63.0% |
| Armenians | 98.9 /100 | #75 | Exceptional 63.0% |
| Paraguayans | 98.8 /100 | #76 | Exceptional 62.9% |
| Ethiopians | 98.8 /100 | #77 | Exceptional 62.9% |
| Immigrants | Lebanon | 98.8 /100 | #78 | Exceptional 62.9% |
| Northern Europeans | 98.8 /100 | #79 | Exceptional 62.9% |
| Lithuanians | 98.8 /100 | #80 | Exceptional 62.9% |
| Laotians | 98.7 /100 | #81 | Exceptional 62.8% |
| Immigrants | Bolivia | 98.7 /100 | #82 | Exceptional 62.8% |
| Immigrants | Argentina | 98.6 /100 | #83 | Exceptional 62.8% |