English vs Paraguayan College, 1 year or more
COMPARE
English
Paraguayan
College, 1 year or more
College, 1 year or more Comparison
English
Paraguayans
60.0%
COLLEGE, 1 YEAR OR MORE
67.2/ 100
METRIC RATING
158th/ 347
METRIC RANK
62.9%
COLLEGE, 1 YEAR OR MORE
98.8/ 100
METRIC RATING
76th/ 347
METRIC RANK
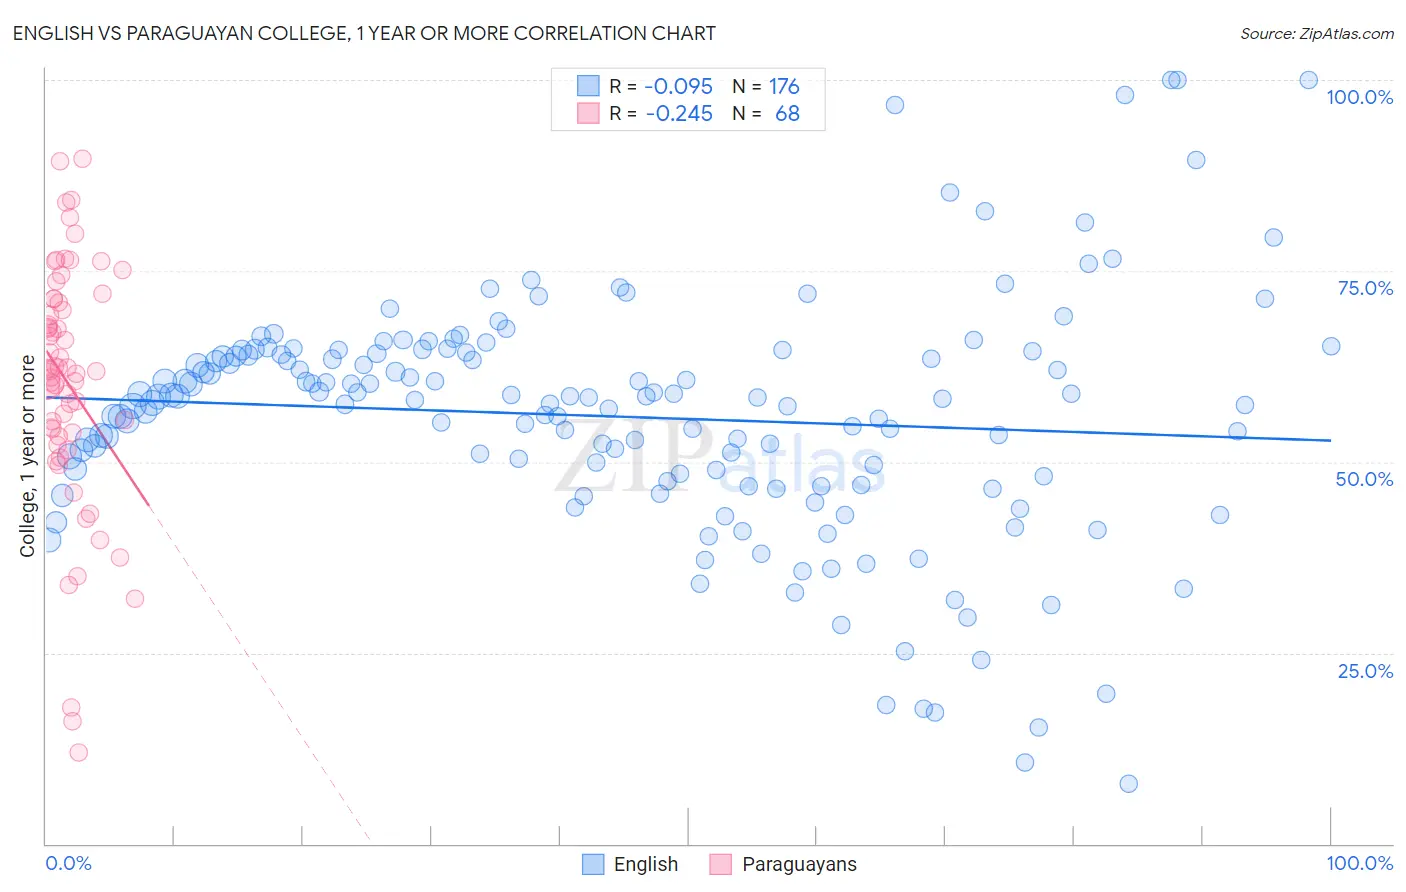
English vs Paraguayan College, 1 year or more Correlation Chart
The statistical analysis conducted on geographies consisting of 579,957,546 people shows a slight negative correlation between the proportion of English and percentage of population with at least college, 1 year or more education in the United States with a correlation coefficient (R) of -0.095 and weighted average of 60.0%. Similarly, the statistical analysis conducted on geographies consisting of 95,113,072 people shows a weak negative correlation between the proportion of Paraguayans and percentage of population with at least college, 1 year or more education in the United States with a correlation coefficient (R) of -0.245 and weighted average of 62.9%, a difference of 4.9%.
College, 1 year or more Correlation Summary
| Measurement | English | Paraguayan |
| Minimum | 7.9% | 11.9% |
| Maximum | 100.0% | 89.8% |
| Range | 92.1% | 77.9% |
| Mean | 55.9% | 60.3% |
| Median | 58.3% | 61.9% |
| Interquartile 25% (IQ1) | 47.8% | 53.5% |
| Interquartile 75% (IQ3) | 64.2% | 71.1% |
| Interquartile Range (IQR) | 16.4% | 17.6% |
| Standard Deviation (Sample) | 15.8% | 16.1% |
| Standard Deviation (Population) | 15.8% | 16.0% |
Similar Demographics by College, 1 year or more
Demographics Similar to English by College, 1 year or more
In terms of college, 1 year or more, the demographic groups most similar to English are Immigrants from Iraq (60.0%, a difference of 0.010%), South American Indian (60.0%, a difference of 0.020%), Immigrants from Armenia (60.0%, a difference of 0.10%), Somali (59.9%, a difference of 0.15%), and Sudanese (60.2%, a difference of 0.36%).
| Demographics | Rating | Rank | College, 1 year or more |
| Albanians | 77.8 /100 | #151 | Good 60.4% |
| Immigrants | Germany | 76.1 /100 | #152 | Good 60.3% |
| Sierra Leoneans | 74.1 /100 | #153 | Good 60.2% |
| Sudanese | 73.0 /100 | #154 | Good 60.2% |
| Moroccans | 72.9 /100 | #155 | Good 60.2% |
| Finns | 72.9 /100 | #156 | Good 60.2% |
| Immigrants | Armenia | 68.8 /100 | #157 | Good 60.0% |
| English | 67.2 /100 | #158 | Good 60.0% |
| Immigrants | Iraq | 67.0 /100 | #159 | Good 60.0% |
| South American Indians | 66.9 /100 | #160 | Good 60.0% |
| Somalis | 64.5 /100 | #161 | Good 59.9% |
| Koreans | 58.5 /100 | #162 | Average 59.7% |
| Immigrants | Somalia | 58.3 /100 | #163 | Average 59.7% |
| Belgians | 58.1 /100 | #164 | Average 59.7% |
| Irish | 56.1 /100 | #165 | Average 59.6% |
Demographics Similar to Paraguayans by College, 1 year or more
In terms of college, 1 year or more, the demographic groups most similar to Paraguayans are Ethiopian (62.9%, a difference of 0.0%), Immigrants from Lebanon (62.9%, a difference of 0.020%), Northern European (62.9%, a difference of 0.030%), Lithuanian (62.9%, a difference of 0.070%), and Armenian (63.0%, a difference of 0.10%).
| Demographics | Rating | Rank | College, 1 year or more |
| Immigrants | Zimbabwe | 99.3 /100 | #69 | Exceptional 63.3% |
| Argentineans | 99.2 /100 | #70 | Exceptional 63.2% |
| Immigrants | Canada | 99.1 /100 | #71 | Exceptional 63.1% |
| Egyptians | 99.0 /100 | #72 | Exceptional 63.1% |
| Immigrants | Moldova | 99.0 /100 | #73 | Exceptional 63.0% |
| Immigrants | North America | 99.0 /100 | #74 | Exceptional 63.0% |
| Armenians | 98.9 /100 | #75 | Exceptional 63.0% |
| Paraguayans | 98.8 /100 | #76 | Exceptional 62.9% |
| Ethiopians | 98.8 /100 | #77 | Exceptional 62.9% |
| Immigrants | Lebanon | 98.8 /100 | #78 | Exceptional 62.9% |
| Northern Europeans | 98.8 /100 | #79 | Exceptional 62.9% |
| Lithuanians | 98.8 /100 | #80 | Exceptional 62.9% |
| Laotians | 98.7 /100 | #81 | Exceptional 62.8% |
| Immigrants | Bolivia | 98.7 /100 | #82 | Exceptional 62.8% |
| Immigrants | Argentina | 98.6 /100 | #83 | Exceptional 62.8% |