Immigrants from Spain vs Paraguayan College, 1 year or more
COMPARE
Immigrants from Spain
Paraguayan
College, 1 year or more
College, 1 year or more Comparison
Immigrants from Spain
Paraguayans
63.4%
COLLEGE, 1 YEAR OR MORE
99.4/ 100
METRIC RATING
64th/ 347
METRIC RANK
62.9%
COLLEGE, 1 YEAR OR MORE
98.8/ 100
METRIC RATING
76th/ 347
METRIC RANK
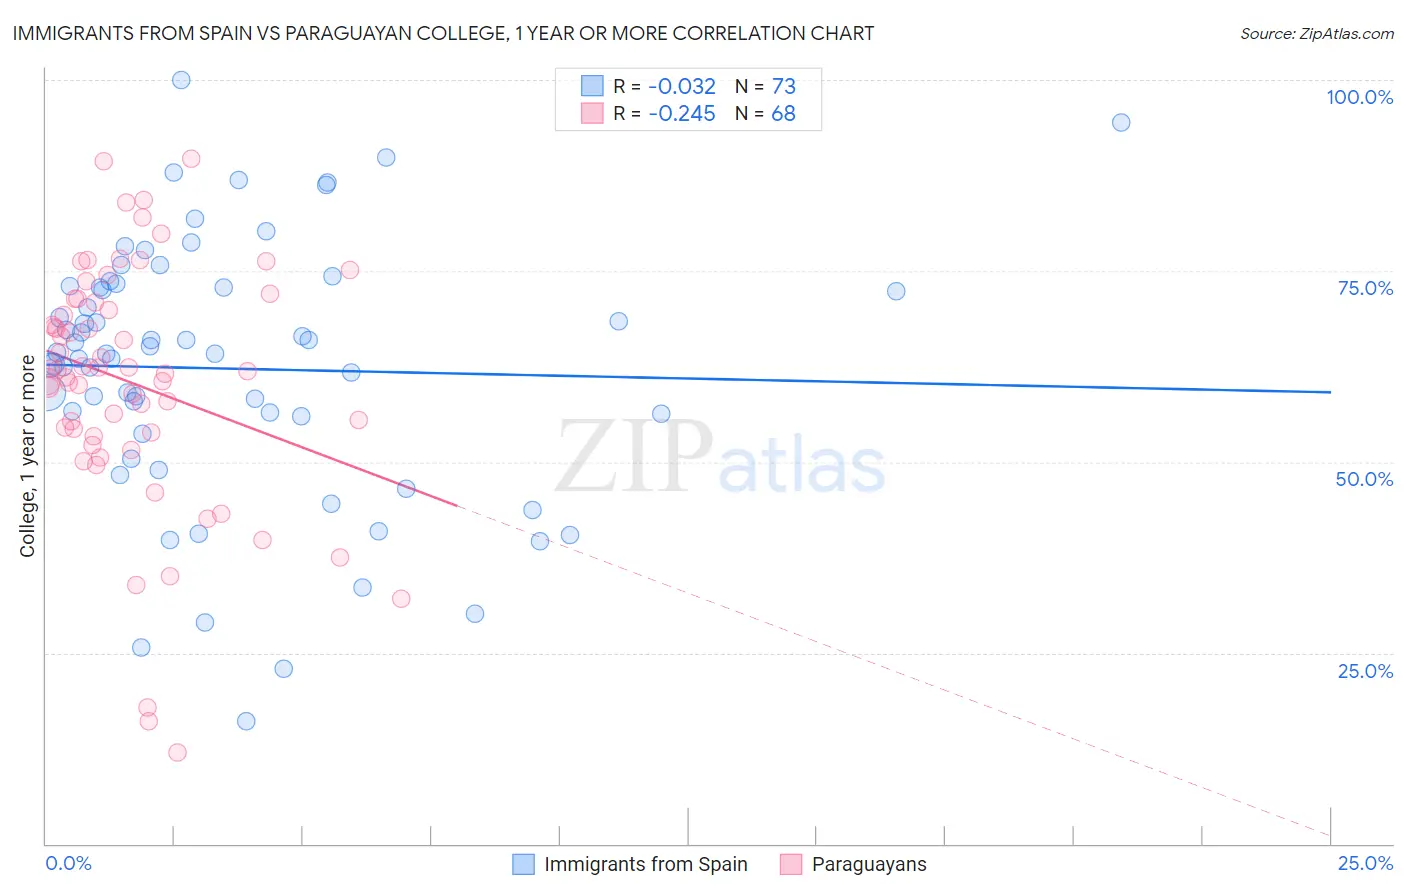
Immigrants from Spain vs Paraguayan College, 1 year or more Correlation Chart
The statistical analysis conducted on geographies consisting of 239,683,962 people shows no correlation between the proportion of Immigrants from Spain and percentage of population with at least college, 1 year or more education in the United States with a correlation coefficient (R) of -0.032 and weighted average of 63.4%. Similarly, the statistical analysis conducted on geographies consisting of 95,113,072 people shows a weak negative correlation between the proportion of Paraguayans and percentage of population with at least college, 1 year or more education in the United States with a correlation coefficient (R) of -0.245 and weighted average of 62.9%, a difference of 0.80%.
College, 1 year or more Correlation Summary
| Measurement | Immigrants from Spain | Paraguayan |
| Minimum | 16.1% | 11.9% |
| Maximum | 100.0% | 89.8% |
| Range | 83.9% | 77.9% |
| Mean | 62.2% | 60.3% |
| Median | 64.1% | 61.9% |
| Interquartile 25% (IQ1) | 54.8% | 53.5% |
| Interquartile 75% (IQ3) | 72.9% | 71.1% |
| Interquartile Range (IQR) | 18.1% | 17.6% |
| Standard Deviation (Sample) | 17.0% | 16.1% |
| Standard Deviation (Population) | 16.9% | 16.0% |
Demographics Similar to Immigrants from Spain and Paraguayans by College, 1 year or more
In terms of college, 1 year or more, the demographic groups most similar to Immigrants from Spain are Immigrants from Scotland (63.4%, a difference of 0.030%), Maltese (63.4%, a difference of 0.10%), Immigrants from Indonesia (63.5%, a difference of 0.16%), Bolivian (63.5%, a difference of 0.18%), and Immigrants from Europe (63.3%, a difference of 0.21%). Similarly, the demographic groups most similar to Paraguayans are Ethiopian (62.9%, a difference of 0.0%), Immigrants from Lebanon (62.9%, a difference of 0.020%), Northern European (62.9%, a difference of 0.030%), Lithuanian (62.9%, a difference of 0.070%), and Armenian (63.0%, a difference of 0.10%).
| Demographics | Rating | Rank | College, 1 year or more |
| Immigrants | Kazakhstan | 99.5 /100 | #60 | Exceptional 63.6% |
| Bolivians | 99.5 /100 | #61 | Exceptional 63.5% |
| Immigrants | Indonesia | 99.5 /100 | #62 | Exceptional 63.5% |
| Immigrants | Scotland | 99.4 /100 | #63 | Exceptional 63.4% |
| Immigrants | Spain | 99.4 /100 | #64 | Exceptional 63.4% |
| Maltese | 99.3 /100 | #65 | Exceptional 63.4% |
| Immigrants | Europe | 99.3 /100 | #66 | Exceptional 63.3% |
| Immigrants | Romania | 99.3 /100 | #67 | Exceptional 63.3% |
| Immigrants | Greece | 99.3 /100 | #68 | Exceptional 63.3% |
| Immigrants | Zimbabwe | 99.3 /100 | #69 | Exceptional 63.3% |
| Argentineans | 99.2 /100 | #70 | Exceptional 63.2% |
| Immigrants | Canada | 99.1 /100 | #71 | Exceptional 63.1% |
| Egyptians | 99.0 /100 | #72 | Exceptional 63.1% |
| Immigrants | Moldova | 99.0 /100 | #73 | Exceptional 63.0% |
| Immigrants | North America | 99.0 /100 | #74 | Exceptional 63.0% |
| Armenians | 98.9 /100 | #75 | Exceptional 63.0% |
| Paraguayans | 98.8 /100 | #76 | Exceptional 62.9% |
| Ethiopians | 98.8 /100 | #77 | Exceptional 62.9% |
| Immigrants | Lebanon | 98.8 /100 | #78 | Exceptional 62.9% |
| Northern Europeans | 98.8 /100 | #79 | Exceptional 62.9% |
| Lithuanians | 98.8 /100 | #80 | Exceptional 62.9% |