U.S. Virgin Islander vs Immigrants from Indonesia College, 1 year or more
COMPARE
U.S. Virgin Islander
Immigrants from Indonesia
College, 1 year or more
College, 1 year or more Comparison
U.S. Virgin Islanders
Immigrants from Indonesia
54.8%
COLLEGE, 1 YEAR OR MORE
0.3/ 100
METRIC RATING
263rd/ 347
METRIC RANK
63.5%
COLLEGE, 1 YEAR OR MORE
99.5/ 100
METRIC RATING
62nd/ 347
METRIC RANK
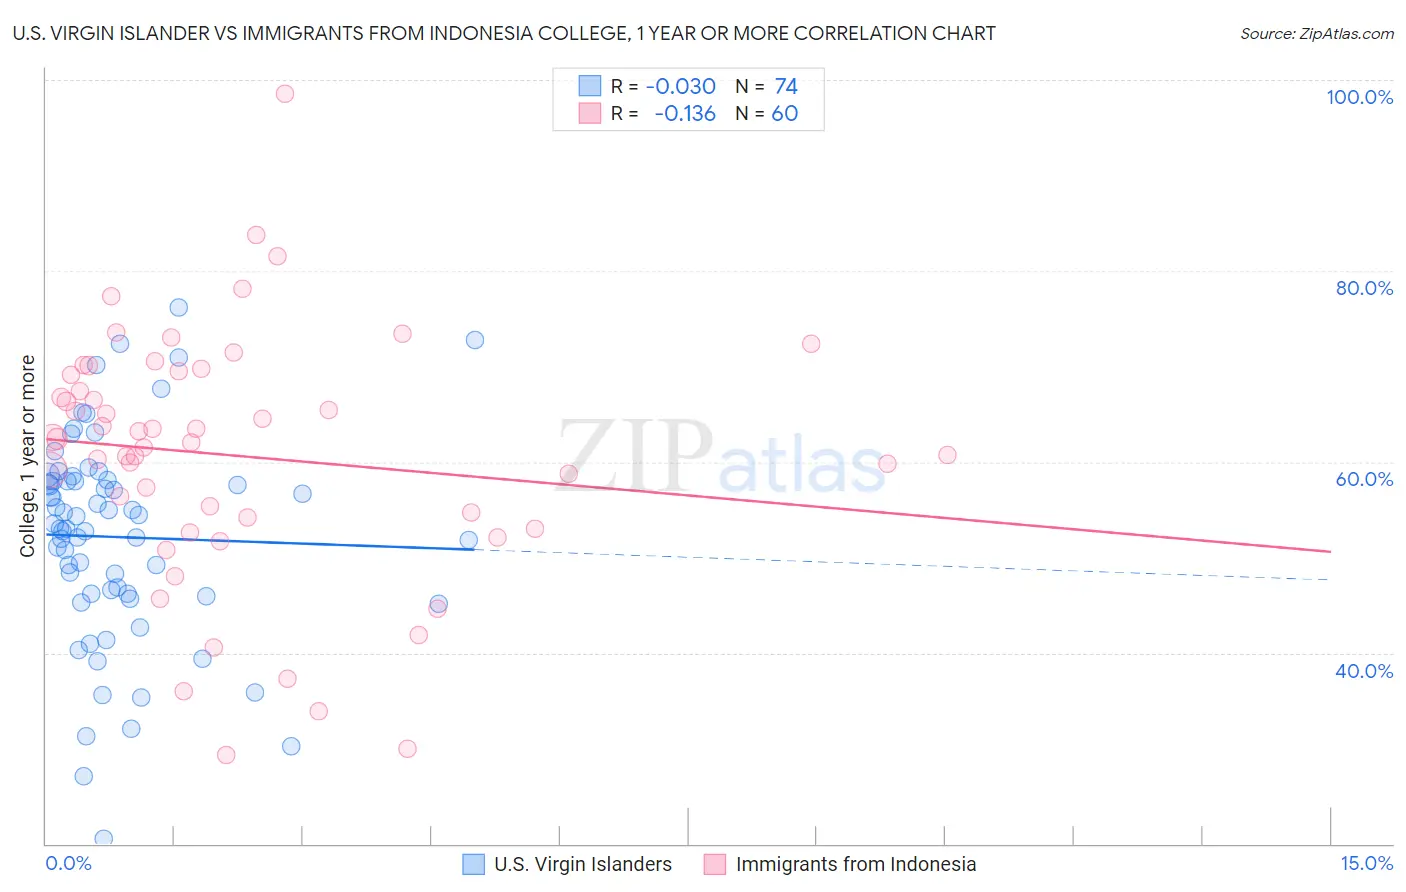
U.S. Virgin Islander vs Immigrants from Indonesia College, 1 year or more Correlation Chart
The statistical analysis conducted on geographies consisting of 87,526,675 people shows no correlation between the proportion of U.S. Virgin Islanders and percentage of population with at least college, 1 year or more education in the United States with a correlation coefficient (R) of -0.030 and weighted average of 54.8%. Similarly, the statistical analysis conducted on geographies consisting of 215,783,142 people shows a poor negative correlation between the proportion of Immigrants from Indonesia and percentage of population with at least college, 1 year or more education in the United States with a correlation coefficient (R) of -0.136 and weighted average of 63.5%, a difference of 15.9%.
College, 1 year or more Correlation Summary
| Measurement | U.S. Virgin Islander | Immigrants from Indonesia |
| Minimum | 20.5% | 29.3% |
| Maximum | 76.2% | 98.6% |
| Range | 55.7% | 69.3% |
| Mean | 52.1% | 60.6% |
| Median | 53.3% | 62.2% |
| Interquartile 25% (IQ1) | 46.2% | 53.6% |
| Interquartile 75% (IQ3) | 58.0% | 69.3% |
| Interquartile Range (IQR) | 11.8% | 15.7% |
| Standard Deviation (Sample) | 10.9% | 13.2% |
| Standard Deviation (Population) | 10.8% | 13.1% |
Similar Demographics by College, 1 year or more
Demographics Similar to U.S. Virgin Islanders by College, 1 year or more
In terms of college, 1 year or more, the demographic groups most similar to U.S. Virgin Islanders are Immigrants from St. Vincent and the Grenadines (54.8%, a difference of 0.020%), Immigrants from Micronesia (54.8%, a difference of 0.020%), Ottawa (54.9%, a difference of 0.11%), Jamaican (54.9%, a difference of 0.13%), and Immigrants from Laos (54.7%, a difference of 0.22%).
| Demographics | Rating | Rank | College, 1 year or more |
| Immigrants | West Indies | 0.5 /100 | #256 | Tragic 55.2% |
| Indonesians | 0.4 /100 | #257 | Tragic 55.1% |
| Africans | 0.4 /100 | #258 | Tragic 55.0% |
| Nepalese | 0.3 /100 | #259 | Tragic 54.9% |
| Jamaicans | 0.3 /100 | #260 | Tragic 54.9% |
| Ottawa | 0.3 /100 | #261 | Tragic 54.9% |
| Immigrants | St. Vincent and the Grenadines | 0.3 /100 | #262 | Tragic 54.8% |
| U.S. Virgin Islanders | 0.3 /100 | #263 | Tragic 54.8% |
| Immigrants | Micronesia | 0.3 /100 | #264 | Tragic 54.8% |
| Immigrants | Laos | 0.2 /100 | #265 | Tragic 54.7% |
| Potawatomi | 0.2 /100 | #266 | Tragic 54.6% |
| Blackfeet | 0.2 /100 | #267 | Tragic 54.6% |
| British West Indians | 0.2 /100 | #268 | Tragic 54.5% |
| Bangladeshis | 0.2 /100 | #269 | Tragic 54.5% |
| Crow | 0.2 /100 | #270 | Tragic 54.5% |
Demographics Similar to Immigrants from Indonesia by College, 1 year or more
In terms of college, 1 year or more, the demographic groups most similar to Immigrants from Indonesia are Bolivian (63.5%, a difference of 0.010%), Immigrants from Kazakhstan (63.6%, a difference of 0.12%), Immigrants from Scotland (63.4%, a difference of 0.13%), Immigrants from Spain (63.4%, a difference of 0.16%), and Maltese (63.4%, a difference of 0.27%).
| Demographics | Rating | Rank | College, 1 year or more |
| Immigrants | Belarus | 99.7 /100 | #55 | Exceptional 64.1% |
| Immigrants | Czechoslovakia | 99.7 /100 | #56 | Exceptional 64.1% |
| South Africans | 99.7 /100 | #57 | Exceptional 64.1% |
| Immigrants | Asia | 99.7 /100 | #58 | Exceptional 64.0% |
| Immigrants | Serbia | 99.6 /100 | #59 | Exceptional 63.8% |
| Immigrants | Kazakhstan | 99.5 /100 | #60 | Exceptional 63.6% |
| Bolivians | 99.5 /100 | #61 | Exceptional 63.5% |
| Immigrants | Indonesia | 99.5 /100 | #62 | Exceptional 63.5% |
| Immigrants | Scotland | 99.4 /100 | #63 | Exceptional 63.4% |
| Immigrants | Spain | 99.4 /100 | #64 | Exceptional 63.4% |
| Maltese | 99.3 /100 | #65 | Exceptional 63.4% |
| Immigrants | Europe | 99.3 /100 | #66 | Exceptional 63.3% |
| Immigrants | Romania | 99.3 /100 | #67 | Exceptional 63.3% |
| Immigrants | Greece | 99.3 /100 | #68 | Exceptional 63.3% |
| Immigrants | Zimbabwe | 99.3 /100 | #69 | Exceptional 63.3% |