U.S. Virgin Islander vs Immigrants from Bosnia and Herzegovina College, 1 year or more
COMPARE
U.S. Virgin Islander
Immigrants from Bosnia and Herzegovina
College, 1 year or more
College, 1 year or more Comparison
U.S. Virgin Islanders
Immigrants from Bosnia and Herzegovina
54.8%
COLLEGE, 1 YEAR OR MORE
0.3/ 100
METRIC RATING
263rd/ 347
METRIC RANK
59.2%
COLLEGE, 1 YEAR OR MORE
42.8/ 100
METRIC RATING
182nd/ 347
METRIC RANK
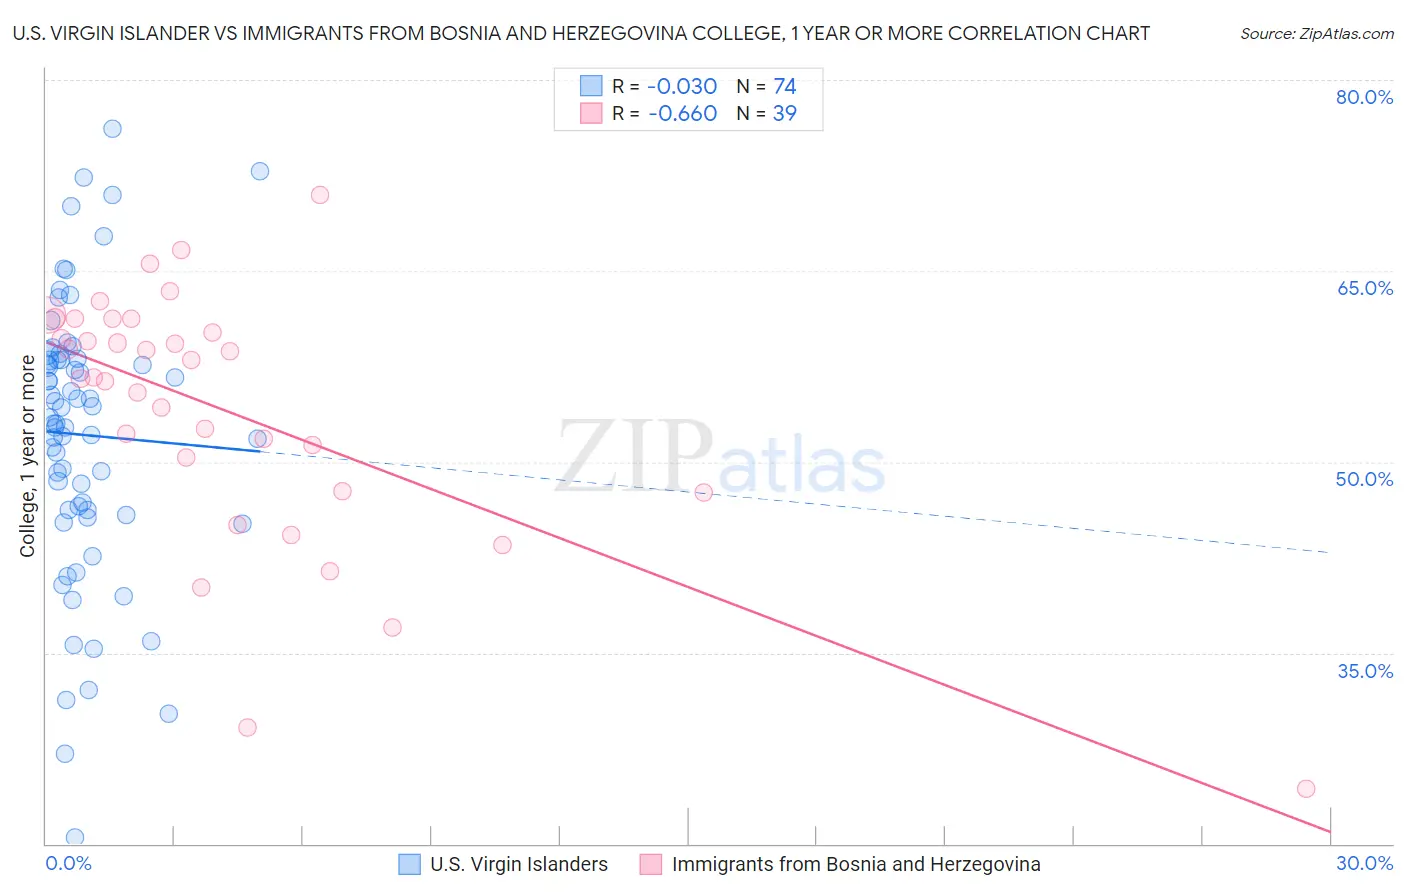
U.S. Virgin Islander vs Immigrants from Bosnia and Herzegovina College, 1 year or more Correlation Chart
The statistical analysis conducted on geographies consisting of 87,526,675 people shows no correlation between the proportion of U.S. Virgin Islanders and percentage of population with at least college, 1 year or more education in the United States with a correlation coefficient (R) of -0.030 and weighted average of 54.8%. Similarly, the statistical analysis conducted on geographies consisting of 156,819,513 people shows a significant negative correlation between the proportion of Immigrants from Bosnia and Herzegovina and percentage of population with at least college, 1 year or more education in the United States with a correlation coefficient (R) of -0.660 and weighted average of 59.2%, a difference of 8.0%.
College, 1 year or more Correlation Summary
| Measurement | U.S. Virgin Islander | Immigrants from Bosnia and Herzegovina |
| Minimum | 20.5% | 24.4% |
| Maximum | 76.2% | 71.0% |
| Range | 55.7% | 46.6% |
| Mean | 52.1% | 54.0% |
| Median | 53.3% | 56.6% |
| Interquartile 25% (IQ1) | 46.2% | 47.7% |
| Interquartile 75% (IQ3) | 58.0% | 61.2% |
| Interquartile Range (IQR) | 11.8% | 13.5% |
| Standard Deviation (Sample) | 10.9% | 10.0% |
| Standard Deviation (Population) | 10.8% | 9.9% |
Similar Demographics by College, 1 year or more
Demographics Similar to U.S. Virgin Islanders by College, 1 year or more
In terms of college, 1 year or more, the demographic groups most similar to U.S. Virgin Islanders are Immigrants from St. Vincent and the Grenadines (54.8%, a difference of 0.020%), Immigrants from Micronesia (54.8%, a difference of 0.020%), Ottawa (54.9%, a difference of 0.11%), Jamaican (54.9%, a difference of 0.13%), and Immigrants from Laos (54.7%, a difference of 0.22%).
| Demographics | Rating | Rank | College, 1 year or more |
| Immigrants | West Indies | 0.5 /100 | #256 | Tragic 55.2% |
| Indonesians | 0.4 /100 | #257 | Tragic 55.1% |
| Africans | 0.4 /100 | #258 | Tragic 55.0% |
| Nepalese | 0.3 /100 | #259 | Tragic 54.9% |
| Jamaicans | 0.3 /100 | #260 | Tragic 54.9% |
| Ottawa | 0.3 /100 | #261 | Tragic 54.9% |
| Immigrants | St. Vincent and the Grenadines | 0.3 /100 | #262 | Tragic 54.8% |
| U.S. Virgin Islanders | 0.3 /100 | #263 | Tragic 54.8% |
| Immigrants | Micronesia | 0.3 /100 | #264 | Tragic 54.8% |
| Immigrants | Laos | 0.2 /100 | #265 | Tragic 54.7% |
| Potawatomi | 0.2 /100 | #266 | Tragic 54.6% |
| Blackfeet | 0.2 /100 | #267 | Tragic 54.6% |
| British West Indians | 0.2 /100 | #268 | Tragic 54.5% |
| Bangladeshis | 0.2 /100 | #269 | Tragic 54.5% |
| Crow | 0.2 /100 | #270 | Tragic 54.5% |
Demographics Similar to Immigrants from Bosnia and Herzegovina by College, 1 year or more
In terms of college, 1 year or more, the demographic groups most similar to Immigrants from Bosnia and Herzegovina are Swiss (59.2%, a difference of 0.030%), Yugoslavian (59.2%, a difference of 0.070%), German Russian (59.1%, a difference of 0.19%), Bermudan (59.3%, a difference of 0.21%), and Spaniard (59.0%, a difference of 0.25%).
| Demographics | Rating | Rank | College, 1 year or more |
| Sri Lankans | 49.0 /100 | #175 | Average 59.4% |
| Immigrants | Poland | 48.9 /100 | #176 | Average 59.4% |
| Tlingit-Haida | 48.4 /100 | #177 | Average 59.4% |
| Czechoslovakians | 48.3 /100 | #178 | Average 59.4% |
| Bermudans | 46.6 /100 | #179 | Average 59.3% |
| Yugoslavians | 44.1 /100 | #180 | Average 59.2% |
| Swiss | 43.4 /100 | #181 | Average 59.2% |
| Immigrants | Bosnia and Herzegovina | 42.8 /100 | #182 | Average 59.2% |
| German Russians | 39.3 /100 | #183 | Fair 59.1% |
| Spaniards | 38.3 /100 | #184 | Fair 59.0% |
| South Americans | 35.9 /100 | #185 | Fair 59.0% |
| Scotch-Irish | 34.7 /100 | #186 | Fair 58.9% |
| Germans | 34.7 /100 | #187 | Fair 58.9% |
| French | 34.4 /100 | #188 | Fair 58.9% |
| Uruguayans | 31.8 /100 | #189 | Fair 58.8% |