Maltese vs Paraguayan College, 1 year or more
COMPARE
Maltese
Paraguayan
College, 1 year or more
College, 1 year or more Comparison
Maltese
Paraguayans
63.4%
COLLEGE, 1 YEAR OR MORE
99.3/ 100
METRIC RATING
65th/ 347
METRIC RANK
62.9%
COLLEGE, 1 YEAR OR MORE
98.8/ 100
METRIC RATING
76th/ 347
METRIC RANK
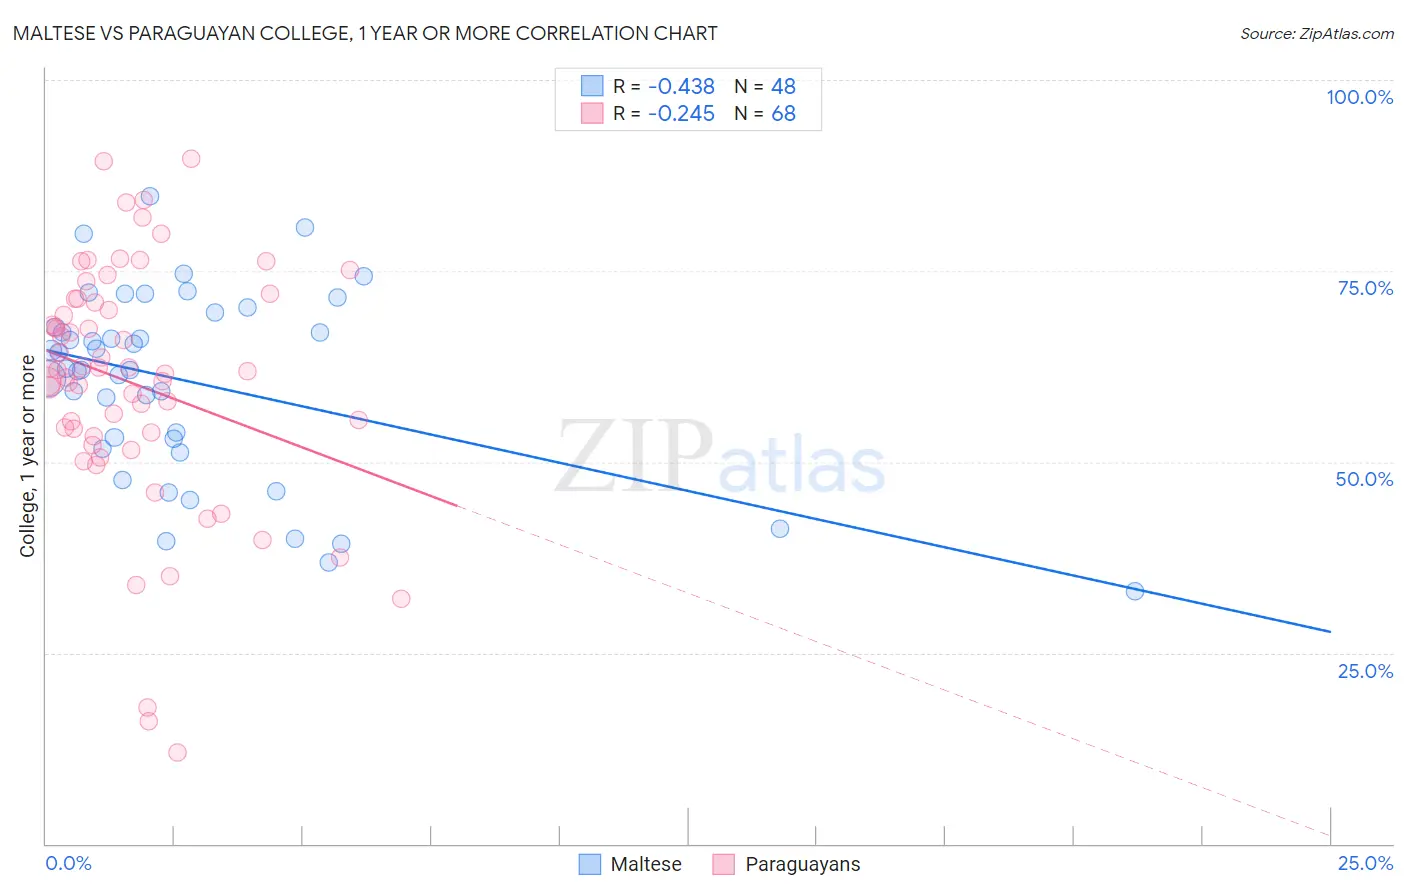
Maltese vs Paraguayan College, 1 year or more Correlation Chart
The statistical analysis conducted on geographies consisting of 126,478,070 people shows a moderate negative correlation between the proportion of Maltese and percentage of population with at least college, 1 year or more education in the United States with a correlation coefficient (R) of -0.438 and weighted average of 63.4%. Similarly, the statistical analysis conducted on geographies consisting of 95,113,072 people shows a weak negative correlation between the proportion of Paraguayans and percentage of population with at least college, 1 year or more education in the United States with a correlation coefficient (R) of -0.245 and weighted average of 62.9%, a difference of 0.70%.
College, 1 year or more Correlation Summary
| Measurement | Maltese | Paraguayan |
| Minimum | 33.0% | 11.9% |
| Maximum | 84.8% | 89.8% |
| Range | 51.7% | 77.9% |
| Mean | 60.5% | 60.3% |
| Median | 62.1% | 61.9% |
| Interquartile 25% (IQ1) | 52.3% | 53.5% |
| Interquartile 75% (IQ3) | 68.6% | 71.1% |
| Interquartile Range (IQR) | 16.3% | 17.6% |
| Standard Deviation (Sample) | 12.3% | 16.1% |
| Standard Deviation (Population) | 12.2% | 16.0% |
Demographics Similar to Maltese and Paraguayans by College, 1 year or more
In terms of college, 1 year or more, the demographic groups most similar to Maltese are Immigrants from Spain (63.4%, a difference of 0.10%), Immigrants from Europe (63.3%, a difference of 0.10%), Immigrants from Romania (63.3%, a difference of 0.12%), Immigrants from Scotland (63.4%, a difference of 0.13%), and Immigrants from Greece (63.3%, a difference of 0.14%). Similarly, the demographic groups most similar to Paraguayans are Ethiopian (62.9%, a difference of 0.0%), Immigrants from Lebanon (62.9%, a difference of 0.020%), Northern European (62.9%, a difference of 0.030%), Lithuanian (62.9%, a difference of 0.070%), and Armenian (63.0%, a difference of 0.10%).
| Demographics | Rating | Rank | College, 1 year or more |
| Immigrants | Kazakhstan | 99.5 /100 | #60 | Exceptional 63.6% |
| Bolivians | 99.5 /100 | #61 | Exceptional 63.5% |
| Immigrants | Indonesia | 99.5 /100 | #62 | Exceptional 63.5% |
| Immigrants | Scotland | 99.4 /100 | #63 | Exceptional 63.4% |
| Immigrants | Spain | 99.4 /100 | #64 | Exceptional 63.4% |
| Maltese | 99.3 /100 | #65 | Exceptional 63.4% |
| Immigrants | Europe | 99.3 /100 | #66 | Exceptional 63.3% |
| Immigrants | Romania | 99.3 /100 | #67 | Exceptional 63.3% |
| Immigrants | Greece | 99.3 /100 | #68 | Exceptional 63.3% |
| Immigrants | Zimbabwe | 99.3 /100 | #69 | Exceptional 63.3% |
| Argentineans | 99.2 /100 | #70 | Exceptional 63.2% |
| Immigrants | Canada | 99.1 /100 | #71 | Exceptional 63.1% |
| Egyptians | 99.0 /100 | #72 | Exceptional 63.1% |
| Immigrants | Moldova | 99.0 /100 | #73 | Exceptional 63.0% |
| Immigrants | North America | 99.0 /100 | #74 | Exceptional 63.0% |
| Armenians | 98.9 /100 | #75 | Exceptional 63.0% |
| Paraguayans | 98.8 /100 | #76 | Exceptional 62.9% |
| Ethiopians | 98.8 /100 | #77 | Exceptional 62.9% |
| Immigrants | Lebanon | 98.8 /100 | #78 | Exceptional 62.9% |
| Northern Europeans | 98.8 /100 | #79 | Exceptional 62.9% |
| Lithuanians | 98.8 /100 | #80 | Exceptional 62.9% |