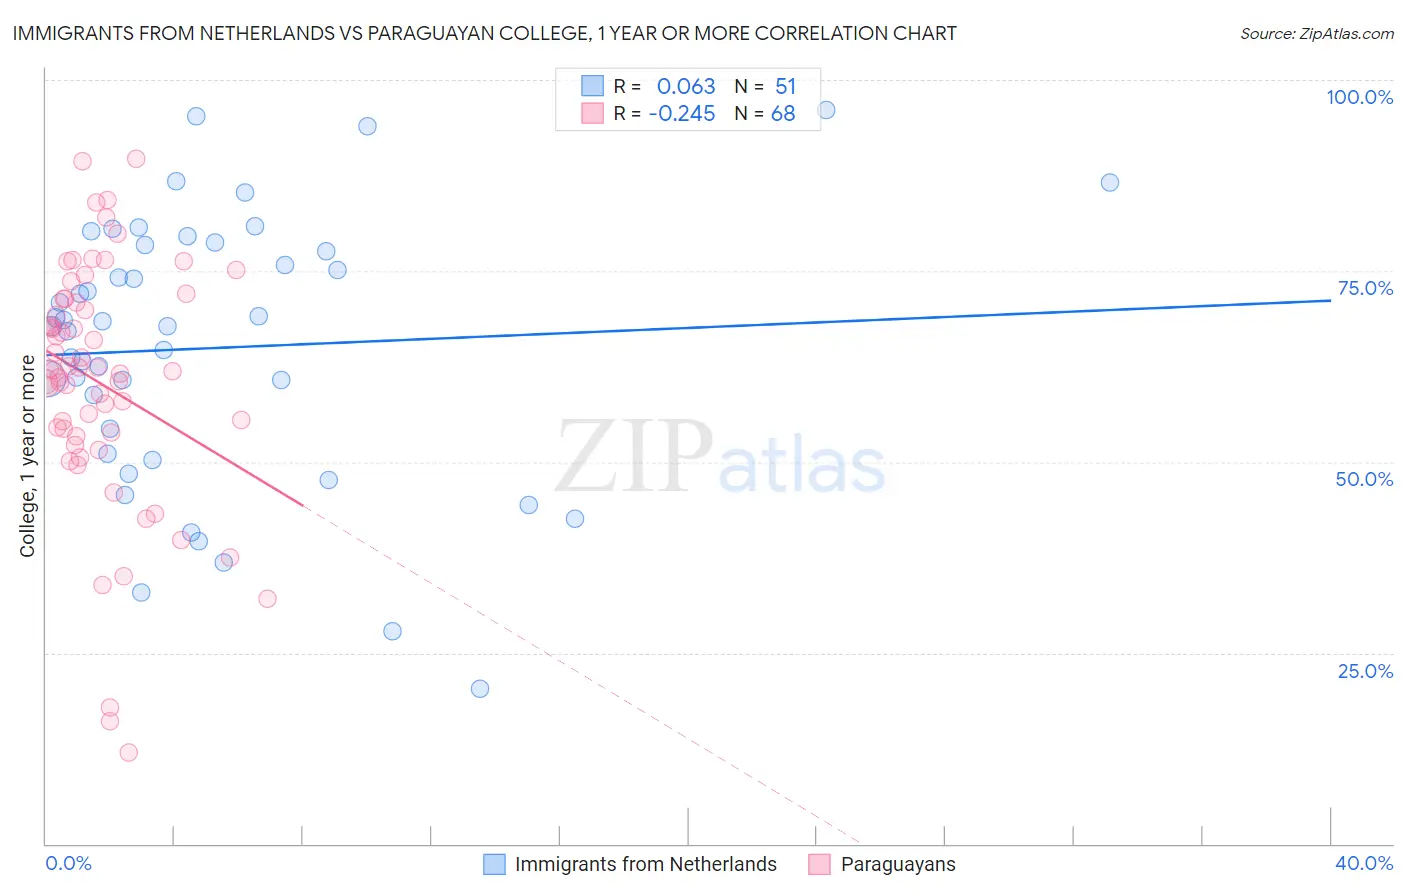
Immigrants from Netherlands vs Paraguayan College, 1 year or more
COMPARE
Immigrants from Netherlands
Paraguayan
College, 1 year or more
College, 1 year or more Comparison
Immigrants from Netherlands
Paraguayans
64.2%
COLLEGE, 1 YEAR OR MORE
99.8/ 100
METRIC RATING
52nd/ 347
METRIC RANK
62.9%
COLLEGE, 1 YEAR OR MORE
98.8/ 100
METRIC RATING
76th/ 347
METRIC RANK
Immigrants from Netherlands vs Paraguayan College, 1 year or more Correlation Chart
The statistical analysis conducted on geographies consisting of 237,877,405 people shows a slight positive correlation between the proportion of Immigrants from Netherlands and percentage of population with at least college, 1 year or more education in the United States with a correlation coefficient (R) of 0.063 and weighted average of 64.2%. Similarly, the statistical analysis conducted on geographies consisting of 95,113,072 people shows a weak negative correlation between the proportion of Paraguayans and percentage of population with at least college, 1 year or more education in the United States with a correlation coefficient (R) of -0.245 and weighted average of 62.9%, a difference of 2.1%.
College, 1 year or more Correlation Summary
| Measurement | Immigrants from Netherlands | Paraguayan |
| Minimum | 20.3% | 11.9% |
| Maximum | 96.1% | 89.8% |
| Range | 75.8% | 77.9% |
| Mean | 64.9% | 60.3% |
| Median | 67.8% | 61.9% |
| Interquartile 25% (IQ1) | 51.0% | 53.5% |
| Interquartile 75% (IQ3) | 78.5% | 71.1% |
| Interquartile Range (IQR) | 27.5% | 17.6% |
| Standard Deviation (Sample) | 17.5% | 16.1% |
| Standard Deviation (Population) | 17.3% | 16.0% |
Similar Demographics by College, 1 year or more
Demographics Similar to Immigrants from Netherlands by College, 1 year or more
In terms of college, 1 year or more, the demographic groups most similar to Immigrants from Netherlands are Asian (64.2%, a difference of 0.020%), Zimbabwean (64.2%, a difference of 0.050%), Immigrants from Malaysia (64.3%, a difference of 0.16%), Immigrants from Belarus (64.1%, a difference of 0.17%), and Immigrants from Czechoslovakia (64.1%, a difference of 0.20%).
| Demographics | Rating | Rank | College, 1 year or more |
| Immigrants | Lithuania | 99.9 /100 | #45 | Exceptional 64.6% |
| Bhutanese | 99.9 /100 | #46 | Exceptional 64.6% |
| Australians | 99.9 /100 | #47 | Exceptional 64.6% |
| Immigrants | Bulgaria | 99.9 /100 | #48 | Exceptional 64.6% |
| New Zealanders | 99.9 /100 | #49 | Exceptional 64.6% |
| Immigrants | Austria | 99.8 /100 | #50 | Exceptional 64.4% |
| Immigrants | Malaysia | 99.8 /100 | #51 | Exceptional 64.3% |
| Immigrants | Netherlands | 99.8 /100 | #52 | Exceptional 64.2% |
| Asians | 99.8 /100 | #53 | Exceptional 64.2% |
| Zimbabweans | 99.8 /100 | #54 | Exceptional 64.2% |
| Immigrants | Belarus | 99.7 /100 | #55 | Exceptional 64.1% |
| Immigrants | Czechoslovakia | 99.7 /100 | #56 | Exceptional 64.1% |
| South Africans | 99.7 /100 | #57 | Exceptional 64.1% |
| Immigrants | Asia | 99.7 /100 | #58 | Exceptional 64.0% |
| Immigrants | Serbia | 99.6 /100 | #59 | Exceptional 63.8% |
Demographics Similar to Paraguayans by College, 1 year or more
In terms of college, 1 year or more, the demographic groups most similar to Paraguayans are Ethiopian (62.9%, a difference of 0.0%), Immigrants from Lebanon (62.9%, a difference of 0.020%), Northern European (62.9%, a difference of 0.030%), Lithuanian (62.9%, a difference of 0.070%), and Armenian (63.0%, a difference of 0.10%).
| Demographics | Rating | Rank | College, 1 year or more |
| Immigrants | Zimbabwe | 99.3 /100 | #69 | Exceptional 63.3% |
| Argentineans | 99.2 /100 | #70 | Exceptional 63.2% |
| Immigrants | Canada | 99.1 /100 | #71 | Exceptional 63.1% |
| Egyptians | 99.0 /100 | #72 | Exceptional 63.1% |
| Immigrants | Moldova | 99.0 /100 | #73 | Exceptional 63.0% |
| Immigrants | North America | 99.0 /100 | #74 | Exceptional 63.0% |
| Armenians | 98.9 /100 | #75 | Exceptional 63.0% |
| Paraguayans | 98.8 /100 | #76 | Exceptional 62.9% |
| Ethiopians | 98.8 /100 | #77 | Exceptional 62.9% |
| Immigrants | Lebanon | 98.8 /100 | #78 | Exceptional 62.9% |
| Northern Europeans | 98.8 /100 | #79 | Exceptional 62.9% |
| Lithuanians | 98.8 /100 | #80 | Exceptional 62.9% |
| Laotians | 98.7 /100 | #81 | Exceptional 62.8% |
| Immigrants | Bolivia | 98.7 /100 | #82 | Exceptional 62.8% |
| Immigrants | Argentina | 98.6 /100 | #83 | Exceptional 62.8% |